IM1.8.1 Texting by the numbers (MVP)
Task 1: Entering and displaying data with GGB
 of the data. You should get a histogram.
Here's my histogram
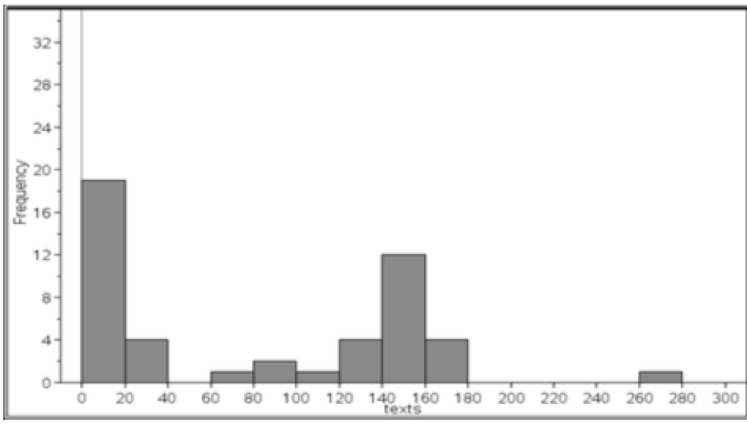
3. Can you make your histogram look like mine? (Hint: you may need to move the pane dividers to make your histogram bigger). 4. Change the display from “Histogram” to “Dot Plot”. How is this view similar or different? 5. Change the display from “Dot Plot” to “Box Plot”. How is this view similar or different? Answer these questions below. 6. What does a box plot show that a histogram and a dot plot do not? 7. What do a histogram and a dot plot show that a box plot does not?
Rachel's Box Plot
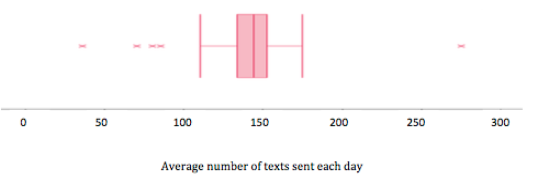
Prior to talking about the data with her mom, Rachel had created a box plot using her own data she collected and it looked quite different than when they combined their data. 8. Looking at Rachel's box plot, which of the following data sets is Rachel's, and which is her mother's? How do you know? Set A: {150, 5.5, 6, 5, 3, 10, 150, 15, 20, 15, 6, 5, 3, 6, 0, 5, 12, 25, 16, 35, 5, 2, 13, 5} Set B: {130, 145, 155, 150, 162, 80, 140, 150, 165, 138, 175, 275, 85, 137, 110, 143, 138, 142, 164,70, 150, 36, 150, 150}
10. Rachel wants to continue sending her normal number of texts (average of 100 per day) and her mom would like her to decrease this by half. Present an argument for each side, using mathematics and the box plots to justify each person’s request.