Google Classroom
Google Classroom
GeoGebra
GeoGebra Classroom
Sign in
Search
Google Classroom
Google Classroom
GeoGebra
GeoGebra Classroom
Outline
Grade 8
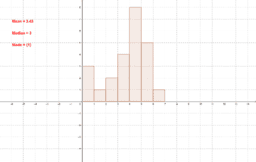
Bar graph and statistics measures
Grade 8
Author:
Vantol Bennett
Bar graph and statistics measures
Next
Bar graph and statistics measures
New Resources
Model sferyczny - dwunastościan-dwudziestościan
Model sferyczny - sześcian-ośmiościan
Hyperbolic Paraboloid
z`]]
Random Polar Curve (3)
Discover Resources
Kulesegment
Kreise v.0.5
Composition Order Matters
Картина в стиле Малевича.
reflect
Modul 18_TURUNAN_SITI HOMSIYAH_SMAN 1 KWANYAR BANGKALAN
Discover Topics
Line Segment
Function Graph
Indefinite Integral
Intersection
Translation