Voronoi diagram

This activity belongs to the GeoGebra book Voronoi Paintings. Let's imagine that we mark two points in the plane. These points can represent real entities, such as water wells, supply stations, health centers, communication centers, urban centers, etc. To avoid possible confusion in the rest of the article, we will call each of these points a site. We can ask ourselves what is the region of the plane whose points are closer to one site than to another. The answer is a half-plane, whose boundary is the perpendicular bisector between both sites. Let's expand the number of sites to a collection of n sites. Take any site P from that collection. What will now be the region of the plane whose points are closer to P than to any other site in the collection? The answer is an intersection of half-planes. Proceeding in the same way for each of the sites, we obtain a division of the plane into n exclusive regions, called Voronoi regions. Thus, each Voronoi region is formed by all the points closest to each site in the given collection. The boundary between two neighboring regions is a piece (segment or ray) of the perpendicular bisector between the sites of the collection corresponding to those two regions. The set of these segments and rays is called a Voronoi diagram (Figure 1). See, for example, [7, 15] for a basic introduction to this concept.
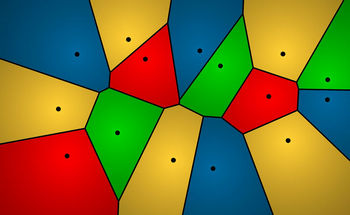
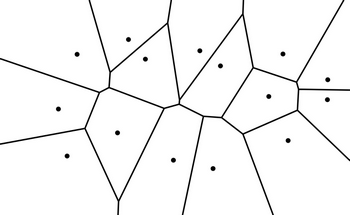
  Figure 1: Regions and Voronoi diagram of a collection of 15 sites

It should be noted that any point in the plane belongs either to the Voronoi diagram or to a single Voronoi region. In other words, the regions and the Voronoi diagram constitute a partition of the plane. GeoGebra has a specific command to create the Voronoi diagram of a collection of sites using a sophisticated internal algorithm. Alternatively, we can create the Voronoi regions in a very simple way. For each site in the collection, we create a circle of the same radius (controlled by a slider) and wide enough to encompass the entire collection. We assign a different color to each circle and activate its trace. Finally, we simultaneously contract all the circles (animating the slider) until they reach their centers. In this way, each point in the plane will acquire different colors, depending on which circle's trace it intersects, but at the end of the process, the "surviving" color will always be the one corresponding to the circle centered on the nearest site in the collection (see [7] for an interactive description with GeoGebra; and also [16], for an illustrative video). The GeoGebra command returns the Voronoi diagram in the form of a graph. As such, note that, in almost all cases, the degree of each node is 3 (three edges converge at the nodes), as in Figure 1. By almost all, we mean the general situation, that is, if we take sites randomly, the probability that all nodes of the corresponding Voronoi diagram have a degree of 3 is 1. Let's remember that, regardless of the method used to construct the Voronoi diagram, in any case, whether general or not, a node is determined by those intersections of perpendicular bisectors that are circumcenters of three sites, so that the circle passing through them does not contain any other site inside. Authors of the activity: Rafael Losada & Tomás Recio.