Google Classroom
Google Classroom
GeoGebra
GeoGebra Classroom
Sign in
Search
Google Classroom
Google Classroom
GeoGebra
GeoGebra Classroom
Outline
Algebra 2 - Lesson 6.3 Part 1
AQR Section 17: Which Histogram has more Variation?
AQR Section 17: Calculating Summary Statistics
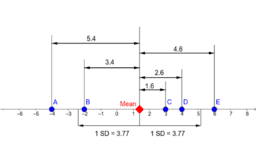
Standard Deviation Investigation
S1_Standard Deviation
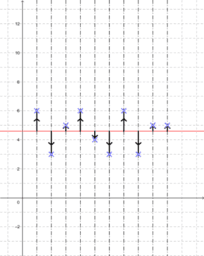
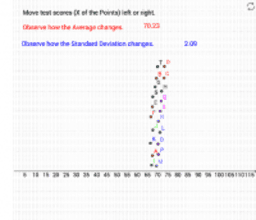
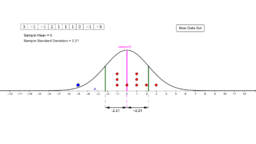
Visual Demo of Standard Deviation
AQR Section 18: Sample Mean and Sample Standard Deviation
Algebra 2 - Lesson 6.3 Part 1
Author:
Jedi Algebron
Topic:
Algebra
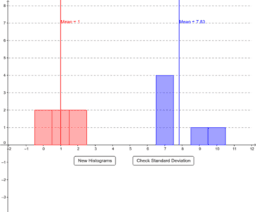
AQR Section 17: Which Histogram has more Variation?
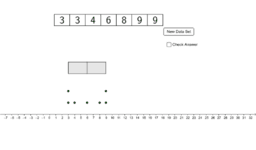
AQR Section 17: Calculating Summary Statistics
Standard Deviation Investigation
S1_Standard Deviation
Visual Demo of Standard Deviation
AQR Section 18: Sample Mean and Sample Standard Deviation
Next
AQR Section 17: Which Histogram has more Variation?
New Resources
Slope and Road Signs
Damped Trochoidal Curve
Untitled
Slope Between 2 Points (Phase 2)
bewijs stelling van Pythagoras
Discover Resources
animation complexe
Triangle Inequality Exploration
One Variable Statistical Analysis
Quiz: Average Rate of Change of a Function (1)
RADIUS IS THE SHORTEST DISTANCE BETWEEN CENTRE AND TANGENT
Discover Topics
Quadrilaterals
Incircle or Inscribed Circle
Integers
Prism
Cuboid