Google Classroom
Google Classroom
GeoGebra
GeoGebra Classroom
Sign in
Search
Google Classroom
Google Classroom
GeoGebra
GeoGebra Classroom
Outline
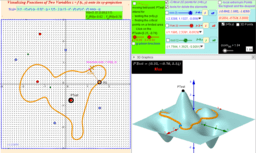
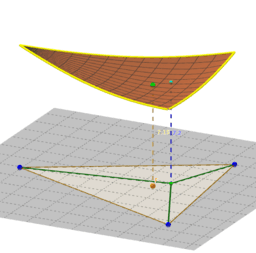
Visualizing Functions of Two Variables 1
Visualizing Functions of Two Variables
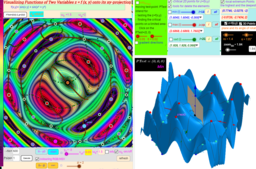
Visualizing Functions of Two Variables. Version 2
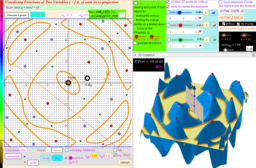
Visualizing Functions of Two Variables. Version 3
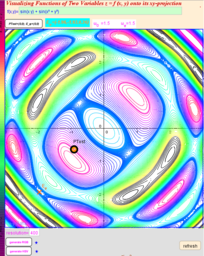
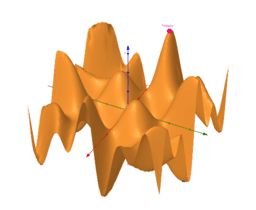
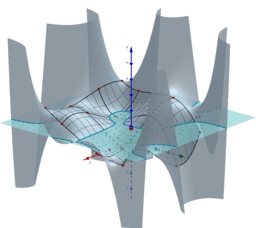
sin(x*y)+sin(x^2+y^2)- Images to Visualizing Functions of Two Variables
Visualizing Functions of Two Variables. Version 3
Contour Plot
Level Curves
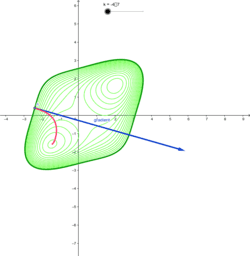
Gradient vs. Level Curves
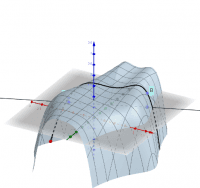
Funktion mit zwei Variablen
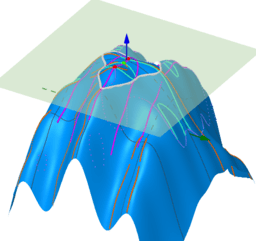
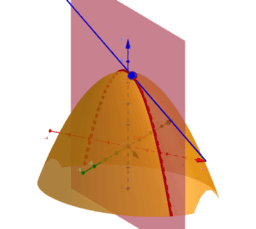
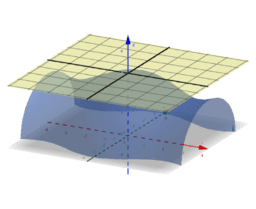
Fläche mit horizontaler Schnittebene
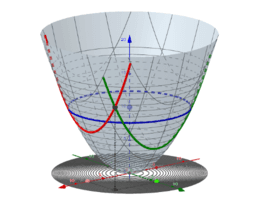
Geodäte auf einer Fläche f(x,y)
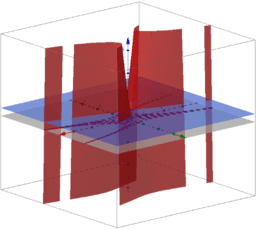
Vektorfeld eines Gradienten
勾配ベクトル場
Tribute to Hilma af Klint
Dodekaederstern
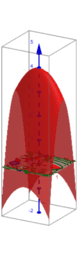
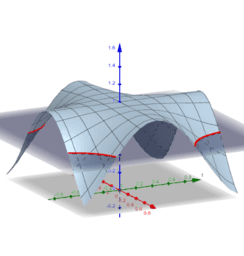
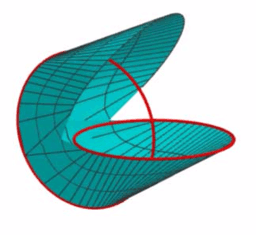
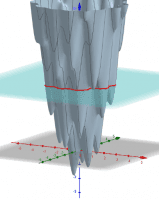
Motzkin-Fläche
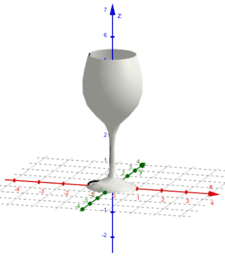
Volumen eines Weinglases
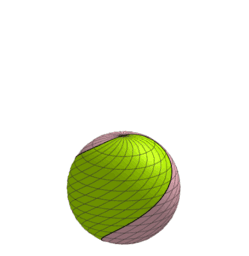
Spiral Screw Bisection of a Sphere
oloide
Directional Derivatives
Multivariable Taylor Approximation
El punt de Fermat
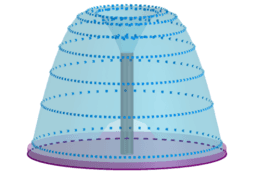
Modelando una Fuente
Exploring functions of 2 variables
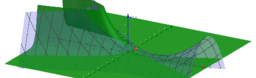
3D-Fläche mit Höhenschichtlinien
Visualizing Functions of Two Variables 1
Author:
Roman Chijner
Topic:
Functions
Visualizing Functions of Two Variables
Visualizing Functions of Two Variables. Version 2
Visualizing Functions of Two Variables. Version 3
sin(x*y)+sin(x^2+y^2)- Images to Visualizing Functions of Two Variables
Visualizing Functions of Two Variables. Version 3
Contour Plot
Level Curves
Gradient vs. Level Curves
Funktion mit zwei Variablen
Fläche mit horizontaler Schnittebene
Geodäte auf einer Fläche f(x,y)
Vektorfeld eines Gradienten
勾配ベクトル場
Tribute to Hilma af Klint
Dodekaederstern
Motzkin-Fläche
Volumen eines Weinglases
Spiral Screw Bisection of a Sphere
oloide
Directional Derivatives
Multivariable Taylor Approximation
El punt de Fermat
Modelando una Fuente
Exploring functions of 2 variables
3D-Fläche mit Höhenschichtlinien
Next
Visualizing Functions of Two Variables
New Resources
Slope Between 2 Points (Phase 2)
Hyperbolic Paraboloid
Some random function
Model sferyczny - sześcian-ośmiościan
အခြေခံ data အခေါ်အဝေါ်များ
Discover Resources
Dilation Grid 3
Square in right triangle
CM2: Rate Growth/Decline Compound
Gissell
kite
Discover Topics
Rational Numbers
Angles
Intersection
Constructions
Combinatorics