3. Some pictures of visualization of a numerical method for determining the type of local extrema of functions with two variables on a contour map without using derivatives
Here are explanatory images from the applet.
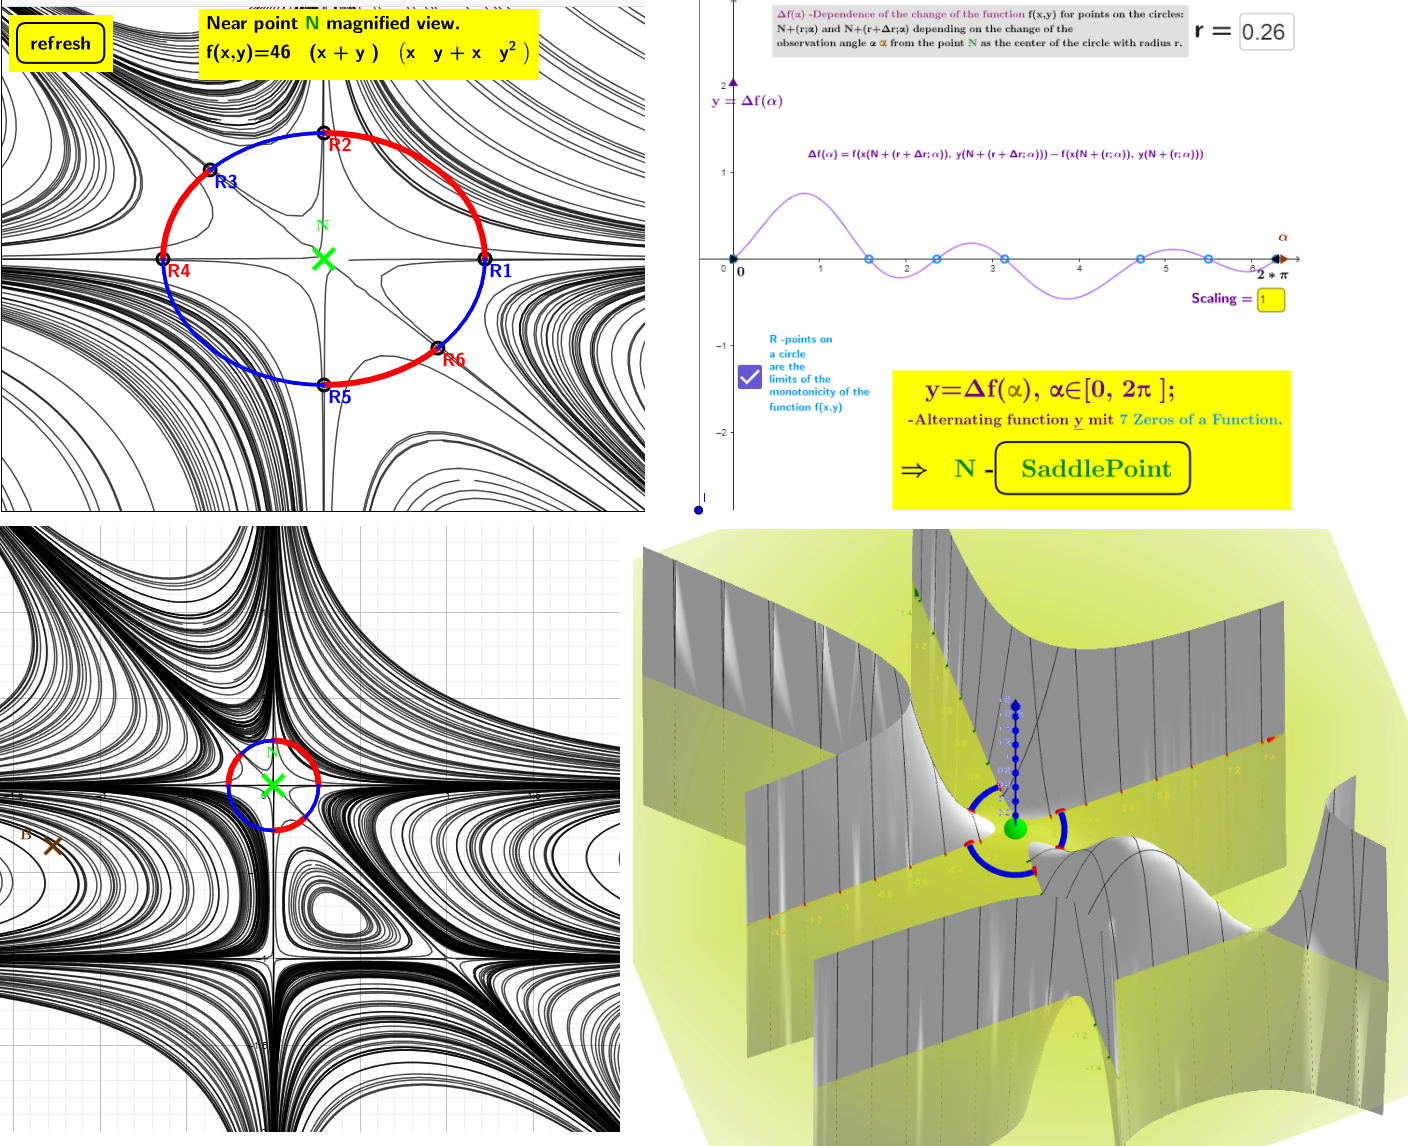
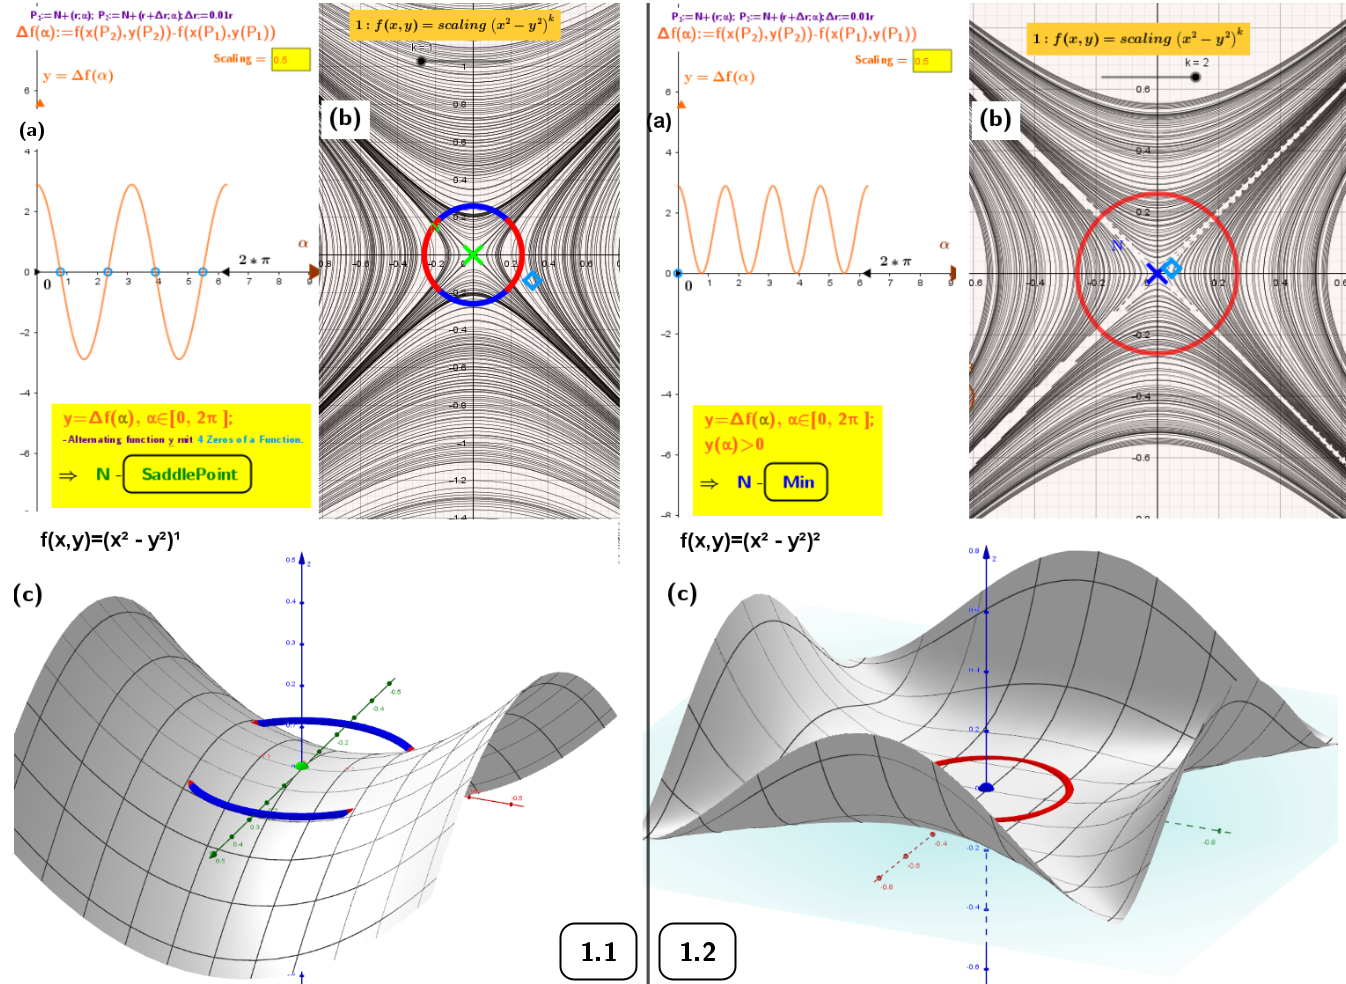
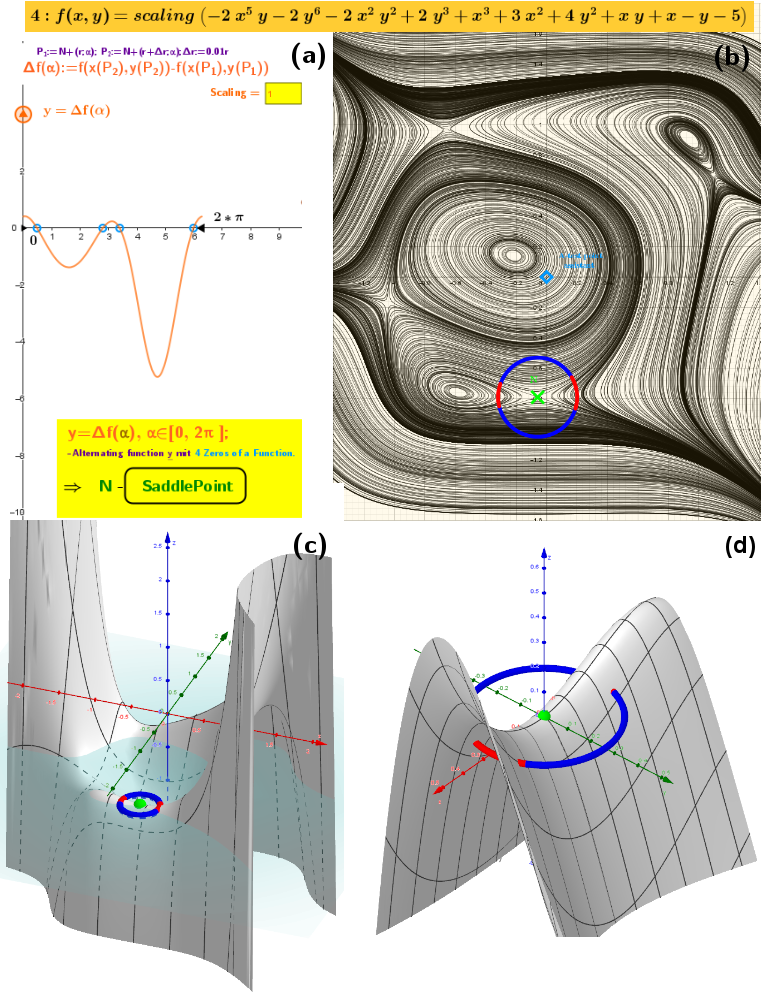
Concentric closed contour lines always indicate either a local minimum or a local maximum. If a contour line intersects itself, the point could be a saddle point, local minimum, or local maximum.
1. ●Cross-shaped contour lines for both the saddle point, known as the monkey saddle, and the local minimum
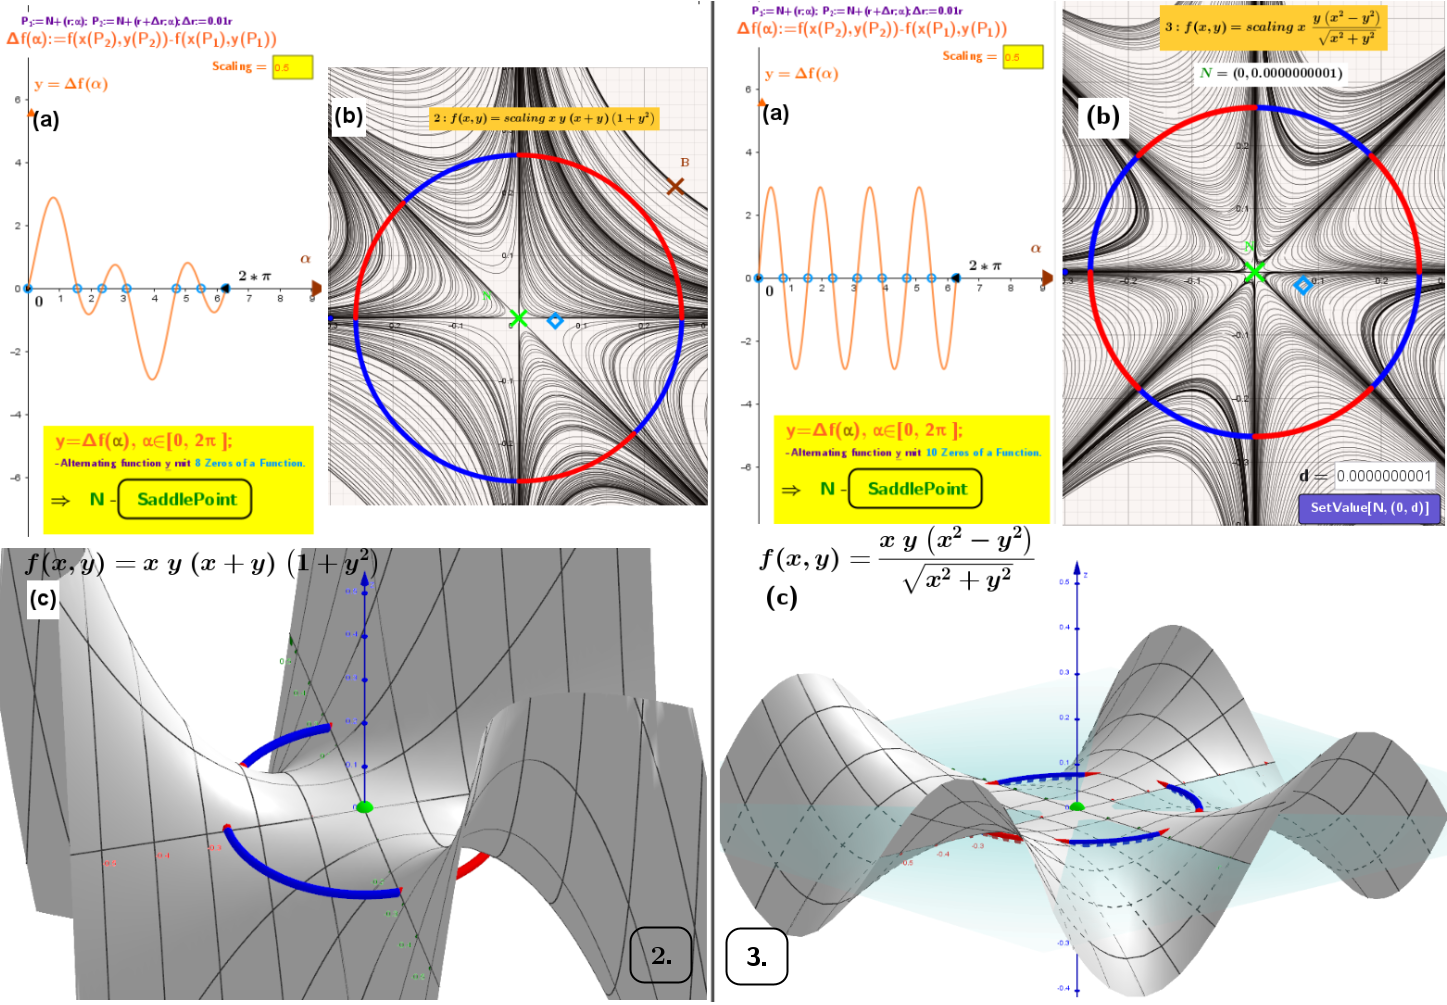
2 and 3. ●Saddle points with "three" and "four" legs
4.
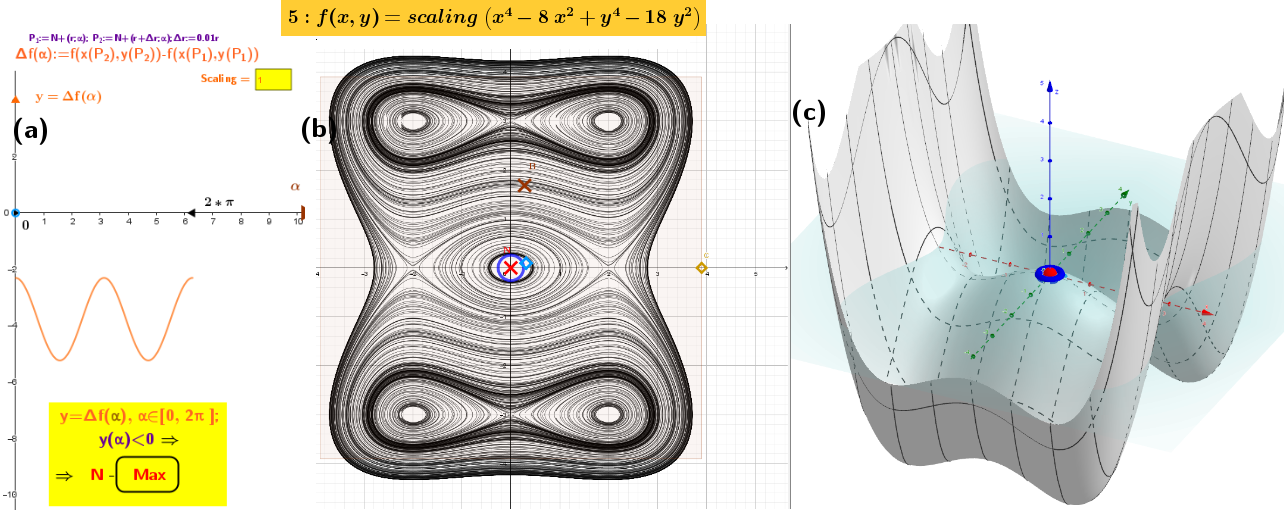
5.
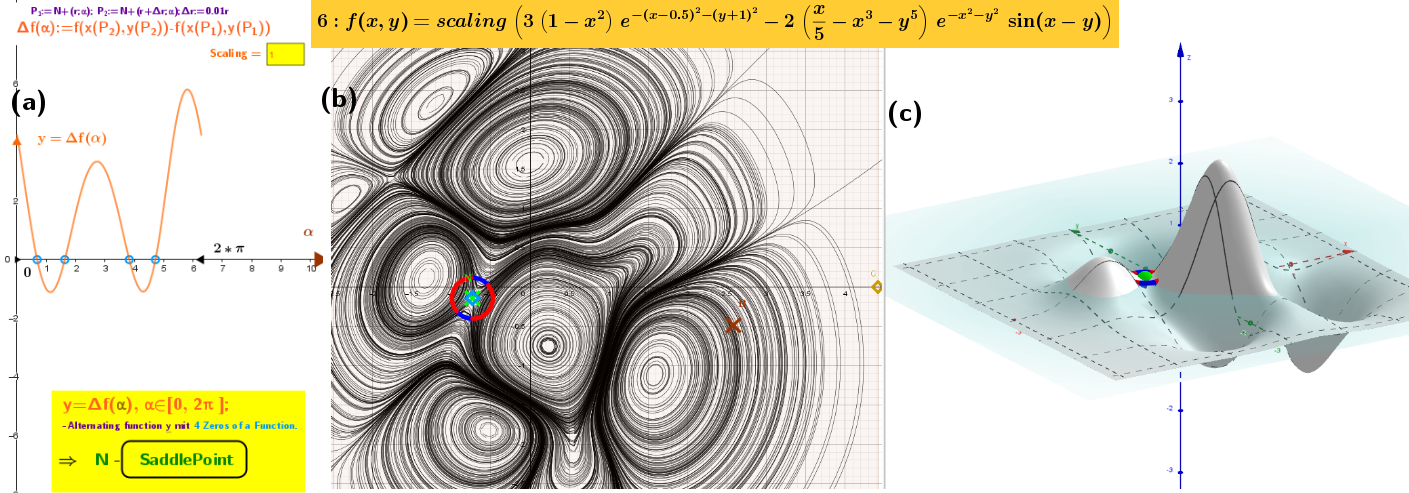
6.
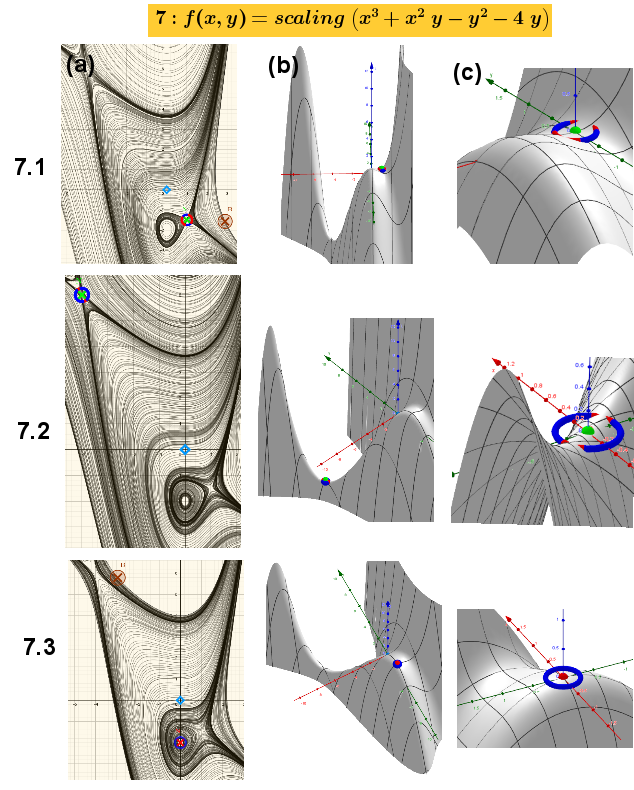
7.
8.
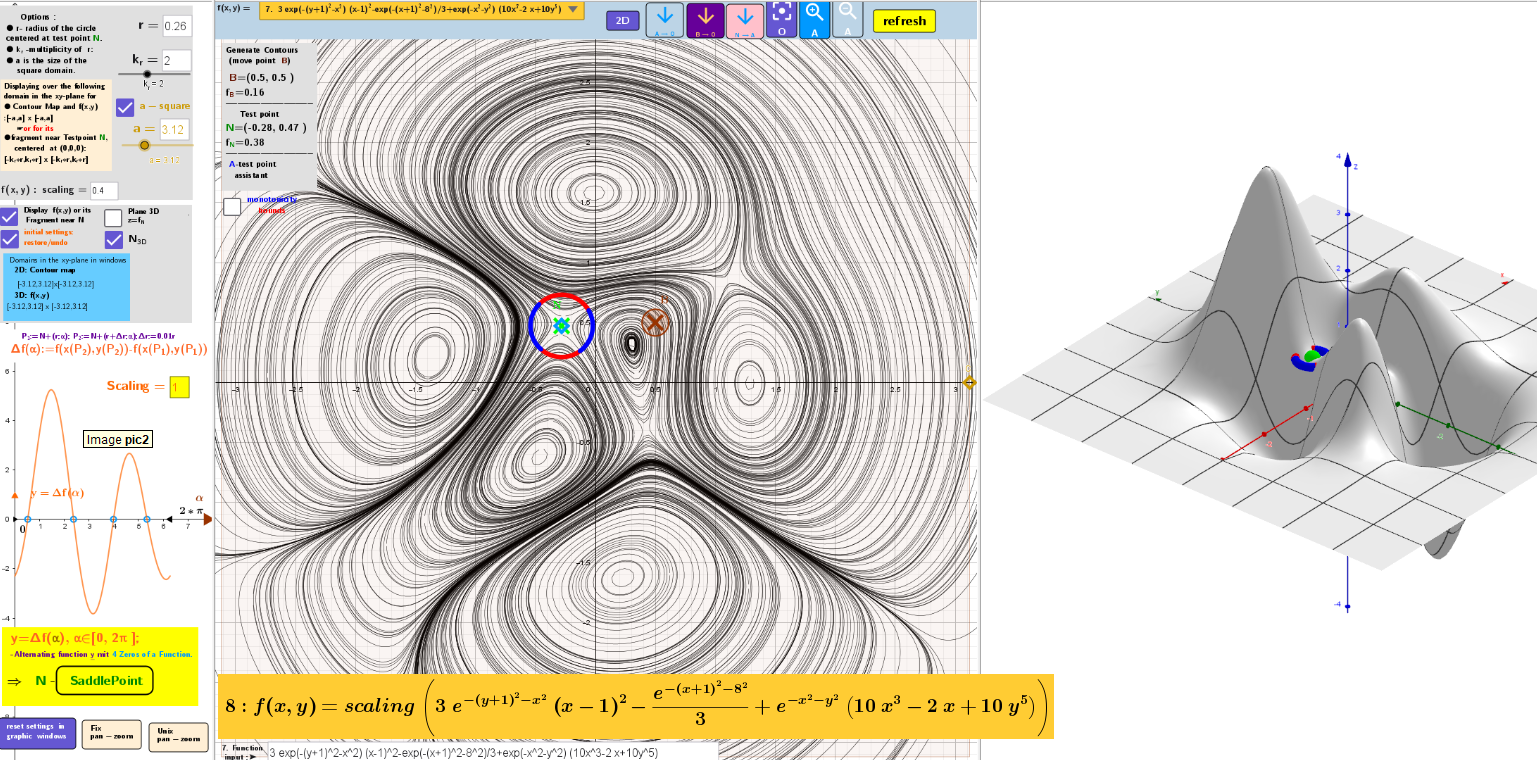
![[size=85]Displaying images of the function f(x,y) and its fragment.[/size]](https://beta.geogebra.org/resource/cve7xhh6/0uIYrKWPHIxEqF7n/material-cve7xhh6.png)
f(x,y)=x y (x+y)(1+y)