Google Classroom
Google Classroom
GeoGebra
GeoGebra Classroom
Sign in
Search
Google Classroom
Google Classroom
GeoGebra
GeoGebra Classroom
Outline
IB - Statistics
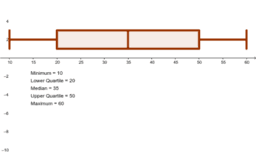
Describing the Distribution (with Box plots)
Box-and-Whisker Plot Generator
IB - Statistics
Author:
Steve Edgar
Topic:
Boxplot
,
Statistics
Describing the Distribution (with Box plots)
Box-and-Whisker Plot Generator
Next
Describing the Distribution (with Box plots)
New Resources
Slope Between 2 Points (Phase 2)
Hyperbolic Paraboloid
Viviani's Curve
Nikmati Keunggulan Di Bandar Judi Terpercaya
apec
Discover Resources
Geometry Honors 06.03 Module Six Quiz
Anscombe's Quartet
Station #5
Optimization (Open Top Box)
Real vs Non Real Solutions for Quadratics
Discover Topics
Derivative
Rational Numbers
Sphere
Intersection
Constructions