L8.6 - The Addition Rule
Learning Intentions and Success Criteria
- Interpret the addition rule in context
- Use the addition rule to calculate probabilities
- Use the addition rule to find probabilities
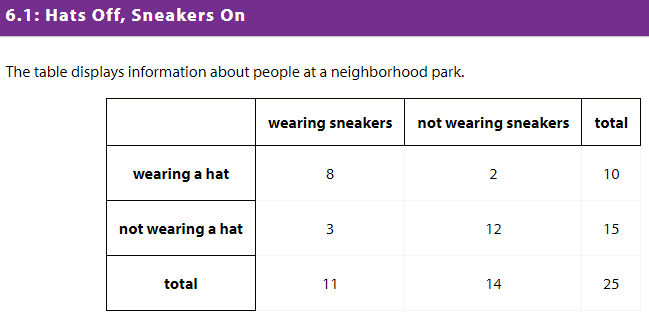
1. Andre says the number of people wearing sneakers or wearing a hat is 21, because there are a total of 10 people wearing a hat and a total of 11 people wearing sneakers. Is Andre correct? Explain your reasoning.
2. What is the probability that a person selected at random from those in the park is wearing sneakers or wearing a hat?
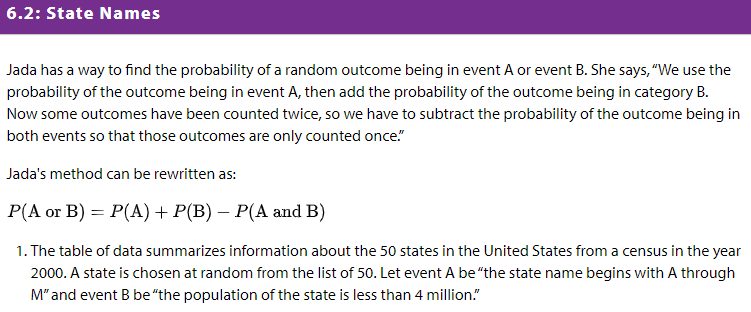
1a. A or B
1b. A
1c. B
1d. A and B
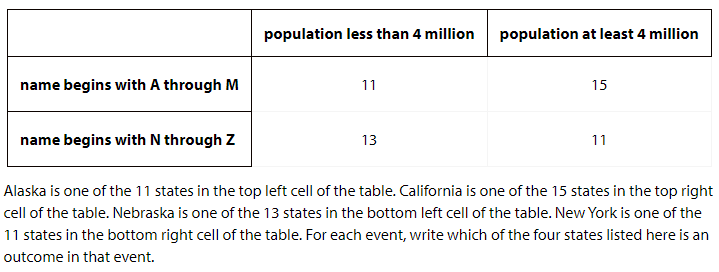
2. Find each of the probabilities when a state is chosen at random: a. P(A or B)
b. P(A)
c. P(B)
d. P(A and B)
3. Does Jada's formula work for these events? Show your reasoning.
4. Seniors at a high school are allowed to go off campus for lunch if they have a grade of A in all their classes or perfect attendance. An assistant principal in charge of academics knows that the probability of a randomly selected senior having A's in all their classes is 0.1. An assistant principal in charge of attendance knows that the probability of a randomly selected senior having perfect attendance is 0.16. The cafeteria staff know that the probability of a randomly selected senior being allowed to go off campus for lunch is 0.18. Use Jada's formula to find the probability that a randomly selected senior has all As and perfect attendance.
b. If a whole number between 1 and 48 inclusive is selected at random, find each probability:
6.3: Coffee or Juice?
1. At a cafe, customers order coffee at the bar, and then either go to another table where the cream and sugar are kept, or find a seat. Based on observations, a worker estimates that 70% of customers go to the second table for cream or sugar. The worker also observes that about 60% of all customers use cream for their coffee and 50% of all customers use sugar. Use the worker's estimates to find the percentage of all customers who use both cream and sugar for their coffee. Explain or show your reasoning.
2. At the grocery store, 70% of the different types of juice come in a bottle holding at least 400 milliliters (mL) and 40% of the different types of juice come in a low-sugar version. Only 25% of the juice varieties are in bottles holding at least 400 mL and have a low-sugar version. What percentage of the different types of juice come in a bottle holding at least 400 mL or are low-sugar? Explain your reasoning.
Use the table to find the probabilities for a juice chosen from the shelf at random.
Learning Intentions and Success Criteria
- Interpret the addition rule in context
- Use the addition rule to calculate probabilities
- Use the addition rule to find probabilities
Cool-Down: Math in Science Class
At a middle school science fair, all the science fair projects used mathematics, but only 30% of the projects display the mean or the median. 27% of all the science fair projects display the mean and 16% of all the science fair projects display the median. 1. Apply the addition rule, P(mean or median) = P(mean) + P(median) - P(mean and median), to find the probability that a randomly selected project at this science fair displays the mean and the median. Explain or show your reasoning.