IM3.7B.3 MOE
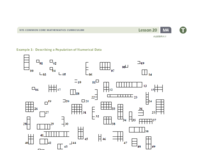
The pdf below contains 100 rectangles of various areas. To select a random sample of 10 rectangles, we're going to use a spreadsheet function to generate lists of random numbers, then find the areas of those rectangles, then calculate the mean area of our sample.
1. In cell A1, type =randombetween(0,99) and press return
2. Hold your cursor over the square in the bottom right corner of this cell to get the + cursor, then drag down to cell A10.
You should now have a list of 10 random numbers between 0 and 99. Find the areas of those rectangles and list them in column B.
1. Calculate the mean and sample standard deviation (s, not σ) of the areas by selecting column B and choosing 1 variable analysis, then show statistics. 2. Use the sample standard deviation to estimate the population standard deviation using this formula: 3. Use this estimate to estimate the margin of error for your sample (2 standard deviations). 4. Report: What does this MOE tell you?