L8.4 - Tables of Relative Frequencies
Learning Intentions and Success Criteria
- Interpret a two-way table that represents a sample space
- Use information in a two-way table to calculate relative frequencies and to estimate probabilities
- Use information in a two-way table to find relative frequencies and to estimate probability

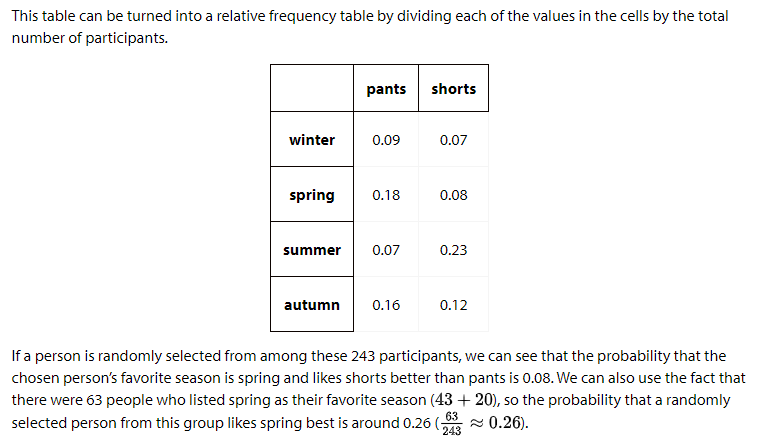
What do you notice? What do you wonder?
4.2: Rolling into Tables
1. Do the values in the table match your expectation? Explain your reasoning.
2. Based on the table, how many times did partner A roll a 5?
3. How many times did you both roll the same number?
4. What percentage of the rolls resulted in the same number from both partners?
5. What percentage of the rolls resulted in partner A rolling a 3 and partner B rolling a 6?
6. Based on the table, estimate the probability that partner A will roll a 2 and partner B will roll a 4. Explain your reasoning.
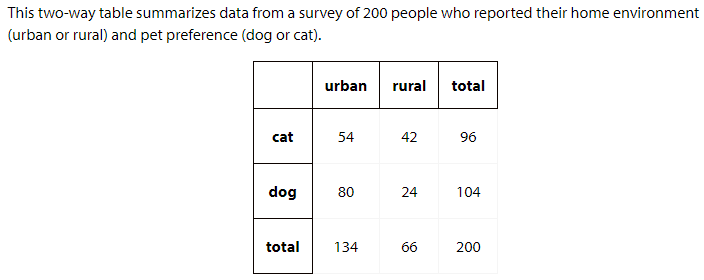
4.3: Traveling Methods
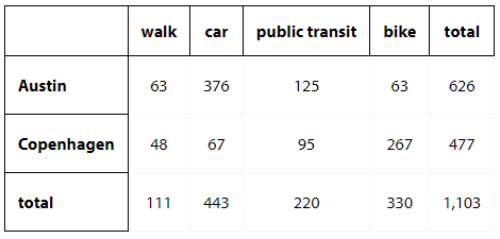
1. If an employee is selected at random, what is the probability that they work in Austin and drive a car to work?
2. If an employee is selected at random, what is the probability that they work in Copenhagen and ride a bike to work?
3. If an employee is selected at random, what is the probability that they take public transit to work?
4. If an employee from Copenhagen is selected at random, what is the probability that they ride a bike to work?
5. If an employee who takes public transit to work is selected at random, what is the probability they work in Austin?
6. How are the last two questions different from the first three?
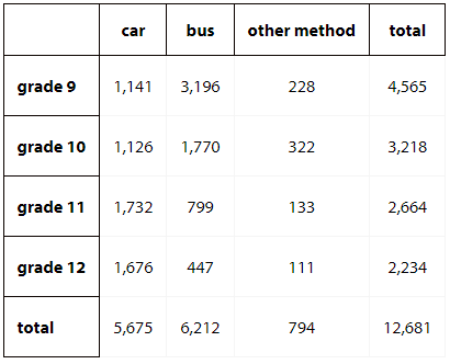
1. If a high school student is selected at random, what is the probability they are in grade 9 and ride the bus to school?
2. If a high school student is selected at random, what is the probability that they are in grade 12?
3. If a high school student is selected at random, what is the probability that they take a car to school?
4. If a grade 10 student is selected at random, what is the probability that they ride a bus to school?
5. If a grade 12 student is selected at random, what is the probability that they ride a bus to school?
6. If a student who rides the bus to school is selected at random, what is the probability that they are in grade 9?
Lesson Synthesis: Tables of Relative Frequencies
Learning Intentions and Success Criteria
- Interpret a two-way table that represents a sample space
- Use information in a two-way table to calculate relative frequencies and to estimate probabilities
- Use information in a two-way table to find relative frequencies and to estimate probability
Cool-Down: School Attendance
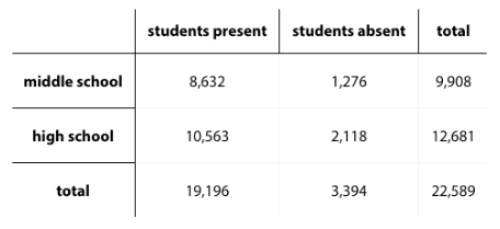
1. If a student’s name is selected at random, what is the probability that they are a middle school student who was present?
2. If high school student’s name is selected at random, what is the probability that they were absent on that day?
3. If a student who was present that day is selected at random, what is the probability that they are in middle school?