Contenuti
Data Handling, Statistics and Probability
Applets, mainly by others that help visualize the data handling, counting. probability and various parameters and statistical calculations
Sommario
Collection of Individual Worksheets by Own and Others
- Visualizing Statistical Information
- Data Visualization
- Dot Plot Tool
- AQR Section 17: Dot Plot and Box-and-Whisker Plot
- AQR Section 16: Matching a Pie Chart to a Dot Plot
- Interactive Dot Diagram(with Illustration of Mean, Median)
- Stem and Leaf Plot Template
- Median and mean visualisation
- Mean Median Mode -Tabulated Data with Visual Mode
- Mean Median Mode -Tabulated Data with Visual Mode Example 2
- AQR Section 17: Mean but Sensitive
- Compare Box and Whisker and Dot Plots
- Boxplot Game
- AQR Section 17: Calculating Summary Statistics
- Cumulative frequency graph and box plot
- Sampling Distribution of the Mean
- Adjustable Historgram
- Randomised Histograms (unequal class widths)
- Drawing Histograms
- From Histograms to Frequency Polygons
- Histogram
- Histogram with unequal class intervals
- Statistics on Number of Rainy Days in Month (1982 to 2019) in Singapore
- Standard Deviation Investigation
- S1_Standard Deviation
- Mean & Standard Deviation of Grouped Data
- Transforming Data
- Distribution of Sample Means
- Probability with Area
- Sample Simulation
- Random Flipping of Coins
- Playing Card Tool (SVG)
- Year 7 Statistics
- Conditional probability: Medical tests and risk of disease
- Introduction to Probability ---- The Rolling of a Die
- Link to David Gurney's Charts and Graphs
- oefening kans met boomdiagram
- Probability and Tree Diagram
- Boomdiagram, dynamisch. (Tree diagram, dynamic)
- oefening kans met boomdiagram
- Permutation of different cards (distinguishable objects)
- Big Tree Diagram
- Probability trees
- Displaying grouped data as individual values and as frequency histogram
- Utility Tool for Calculation of Common Statistical Measures For Grouped Data
- Venn Diagram Word Problems
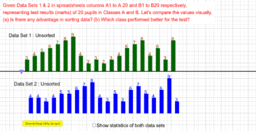
- Descriptive Statistics Dot Plot Box Plot 2 Data Sets
Statistics Activities (John Golden)
Statistical Applets (Advanced Level)
- Chi-square distribution
- Normal Curve with SD slider
- F distribution
- Binomial Distribution with Normal Approximation
- T distribution and standard normal curve
- Binomial Distribution with Normal Approximation
- Sampling Distribution of the Sample Mean
- Central Limit Theorem Demonstration, Uniform Distribution
- Linear Regression
- Empirical and Theoretical Histograms
- Flip a Fair Coin
- Flipping 5 Coins
- Linear Regression with Random Set of Points
- Linear Regression
- Galton Board & Binomial Distribution
- Tree diagram and binomial coefficients
Statistics (collated by sonom)
Others' compilations