Google Classroom
Google Classroom
GeoGebra
GeoGebra Classroom
Abrir sesión
Buscar
Google Classroom
Google Classroom
GeoGebra
GeoGebra Classroom
Esquema
AP Stats
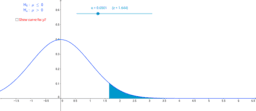
Power and Error Rates for a z-Based Hypothesis Test
AP Stats
Autor:
Paula Torres
Power and Error Rates for a z-Based Hypothesis Test
Siguiente
Power and Error Rates for a z-Based Hypothesis Test
Nuevos recursos
Angle Addition: Warm Up Exercises
Untitled
Random Polar Curve (3)
Viviani's Curve
အခြေခံ data အခေါ်အဝေါ်များ
Descubrir recursos
Internal Angles of Triangle
Kreisbogenabwicklung Vers.1
HHP Distance Two Ways
RuotaTesto
Area of a circle
f(x) = 1/g(x) - Plotter
Generating two different uniformly distributed points on a sphere using one uniform distribution: Regular Tetrahedron V=4.
Descubre temas
Números Reales
Inecuaciones
Test de hipótesis
Paralelepípedo
Números