Google Classroom
Google Classroom
GeoGebra
GeoGebra Ders
Giriş yap
Ara
Google Classroom
Google Classroom
GeoGebra
GeoGebra Ders
Bölüm taslağı
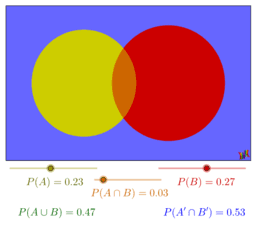
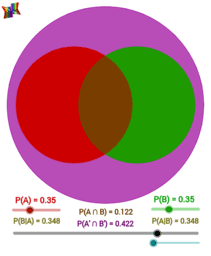
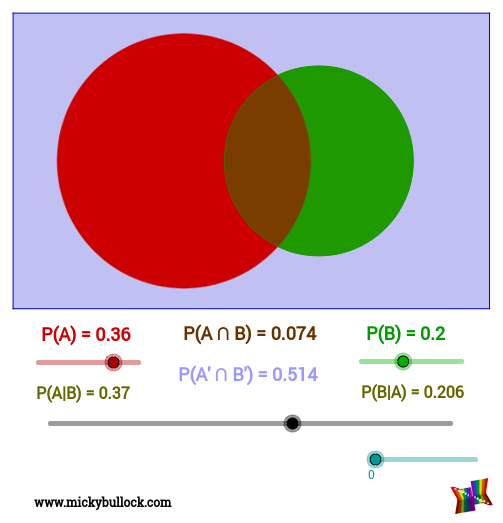
Probability Venn Diagrams
Probability Venn Diagram
Probability Venn Diagram: Circle
Probability Venn Diagram: Rectangle
Probability Venn Diagrams
Yazar:
Micky Bullock
Konu:
Olasılık
Probability Venn Diagram
Probability Venn Diagram: Circle
Probability Venn Diagram: Rectangle
Sonraki
Probability Venn Diagram
Yeni Kaynaklar
Nikmati Keunggulan Di Bandar Judi Terpercaya
Trefoil Knot
רישום חופשי
Slope and Road Signs
Random Polar Curve (3)
Kaynakları Keşfet
Plotting points
สำรวจ4
Testing_Sharing
Volume of Revolution
Spiral Luca
Konuları Keşfet
Sayılar
Çevrel veya Çevreleyen Çember
Doğal Sayılar
Çıkarma
Öteleme