Google Classroom
Google Classroom
GeoGebra
GeoGebra Classroom
Abrir sesión
Buscar
Google Classroom
Google Classroom
GeoGebra
GeoGebra Classroom
Esquema
Statistics
Histograms
Statistics
Autor:
Harcharan Sidhu
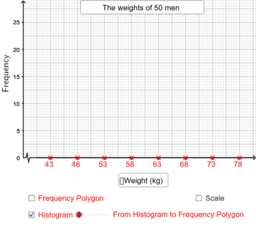
Histograms
From Histograms to Frequency Polygons
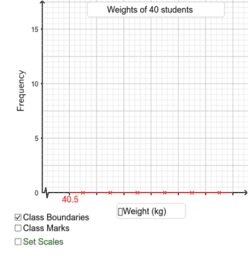
Drawing Histograms
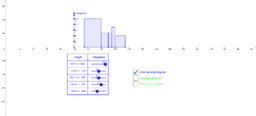
Histogram with unequal class intervals
Siguiente
From Histograms to Frequency Polygons
Nuevos recursos
apec
Slope Between 2 Points (Phase 2)
Rose Curve
Viviani's Curve
Fourier Lissajous (Mechanical)
Descubrir recursos
Sectioning Cone through plane ABC. Plano ABC "cortando" Cone
Teraedru Perpendicular.
Volume with Square Cross-sections on a Parabolic Base
ПАЈАК НА ДЕЛИТЕЛИ
Mini-Quiz #26 Algebra 2 Modeling Exponential Functions
Descubre temas
Pitágoras o Teorema de Pitágoras
Sólidos
Hipérbola
Funciones partidas
Triángulos Semejantes