Google Classroom
Google Classroom
GeoGebra
GeoGebra Klaslokaal
Aanmelden
Zoek
Google Classroom
Google Classroom
GeoGebra
GeoGebra Klaslokaal
Overzicht
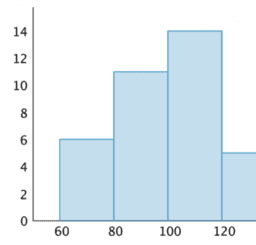
Interpreting Histograms: IM 6.8.6
Lesson 6.8.6
Practice 6.8.6
Interpreting Histograms: IM 6.8.6
Auteur:
GeoGebra Classroom Activities
,
IM 6 – 8 Math
Onderwerp:
Histogram
,
Statistiek
“Interpreting Histograms”
from IM Grade 6 by
Open Up Resources
and Illustrative Mathematics. Licensed under the
Creative Commons Attribution 4.0 license
.
Inhoudstafel
Lesson 6.8.6
IM 6.8.6 Lesson: Interpreting Histograms
Practice 6.8.6
IM 6.8.6 Practice: Interpreting Histograms
Volgende
IM 6.8.6 Lesson: Interpreting Histograms
Nieuw didactisch materiaal
Slope Between 2 Points (Phase 2)
Damped Trochoidal Curve
גיליון אלקטרוני להעלאת נתוני בעיה ויצירת גרף בהתאם
Trefoil Knot
အခြေခံ data အခေါ်အဝေါ်များ
Ontdek materiaal
Right Isoscles Triangle
y=(x+p)^2
Algebra finals
Volume Cone
Addition & Subtraction
Ontdek onderwerpen
Algebra
Getallen
Rechthoek
Gelijkzijdige driehoeken
Hoogtepunt