Google Classroom
Google Classroom
GeoGebra
GeoGebra Classroom
Log ind
Søg
Google Classroom
Google Classroom
GeoGebra
GeoGebra Classroom
Opsummering
Data Displays
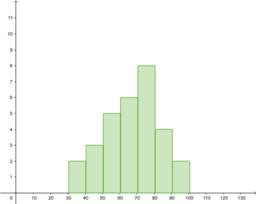
Histogram Worksheet
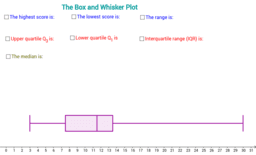
Box Plot
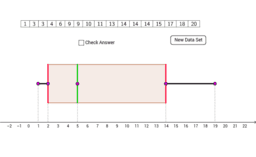
AQR Section 17: Creating a Box and Whisker Plot
Data Displays
Forfatter
MsWallaceMath
Collection of data displays resources
Histogram Worksheet
Box Plot
AQR Section 17: Creating a Box and Whisker Plot
Næste
Histogram Worksheet
Nye Materialer
Damped Trochoidal Curve
seo tool
Model sferyczny - dwunastościan-dwudziestościan
Angle Addition: Warm Up Exercises
Model sferyczny - sześcian-ośmiościan
Opdag Ressourcer
Graph basic
third shape - core connections course 3
Three tangents
Kayla Bote O3 Qtr1Project
Canonical form of a conics
Udforsk emner
Kugle
Plane figurer eller former
Retvinklede trekanter
Cirkel
Aritmetiske operationer