Google Classroom
Google Classroom
GeoGebra
GeoGebra Classroom
Sign in
Search
Google Classroom
Google Classroom
GeoGebra
GeoGebra Classroom
Outline
Pearson Maths A level Stats & Mechanics 1
Representations of data
Correlation
Statistical distributions
Hypothesis testing
Constant acceleration
Variable acceleration
Pearson Maths A level Stats & Mechanics 1
Author:
Latymer
,
Pearson Secondary Maths
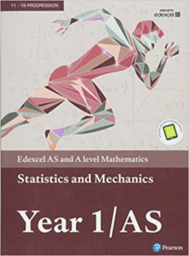
A set of activities designed to be used in conjunction with exercises from Edexcel AS and A level Mathematics: Statistics & Mechanics Year 1/AS
Table of Contents
Representations of data
Box plots: page 44, example 3
Correlation
Correlation: page 64, example 3
Statistical distributions
Statistical distributions: page 93, example 7
Hypothesis testing
Hypothesis testing: page 103, example 4
Constant acceleration
Constant acceleration: page 134, example 3
Variable acceleration
Variable acceleration: page 183, example 3
Next
Box plots: page 44, example 3
New Resources
Pythagorean Template: Integer Legs
Function art 3D - waiting shed
What Do You See?
Quadrant Illustrator 2
GeoGebra 3D Modeling Workshop (March 8 2024)
Discover Resources
Solution to the puzzle at http://www.thebigquestions.com/201
Elliptical Orbit, animated by Mean Anomaly
Equations of Circles
LUAN GAMEPLAYS
Sqrt(17) - CUEBA0035
Discover Topics
Quadratic Functions
Secant Line or Secant
Trapezoid
Mode
Vectors