Google Classroom
Google Classroom
GeoGebra
GeoGebra Classroom
Abrir sesión
Buscar
Google Classroom
Google Classroom
GeoGebra
GeoGebra Classroom
Esquema
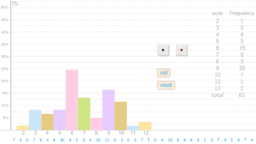
statistics
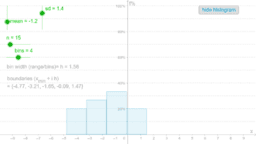
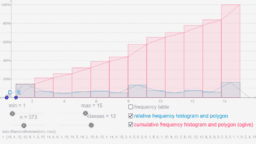
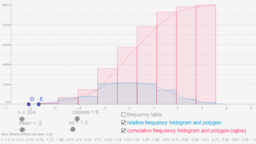
histograms
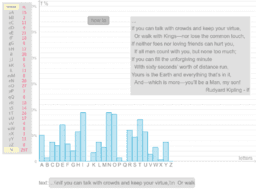
distribution of letters
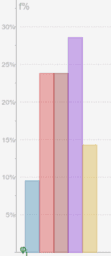
pie chart
Practicing Statistical Calculation-1
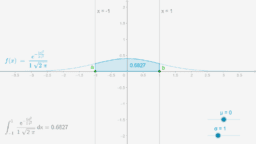
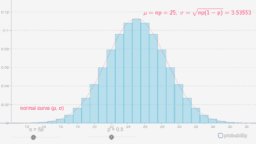
the bell curve
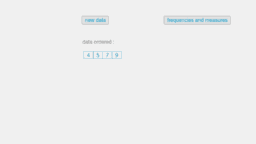
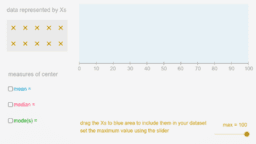
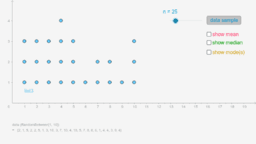
measures of center
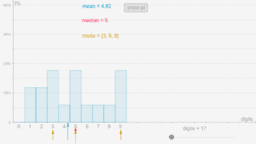
pi digits
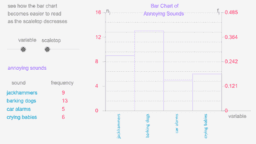
frequency scale
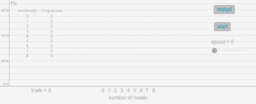
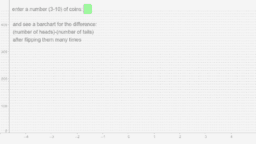
coin flipping-1
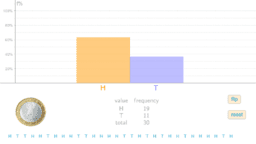
flipping a coin
binomial and normal
random data-1
random data-2
coin tossing simulation
dotplot
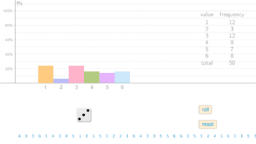
rolling a dice
rolling two dice
statistics
Autor:
sonom
Tema:
Histograma
,
Medias
,
Mediana
,
Moda
,
Estadística
histograms
distribution of letters
pie chart
Practicing Statistical Calculation-1
the bell curve
measures of center
pi digits
frequency scale
coin flipping-1
flipping a coin
binomial and normal
random data-1
random data-2
coin tossing simulation
dotplot
rolling a dice
rolling two dice
Siguiente
histograms
Nuevos recursos
רישום חופשי
seo tool
Damped Trochoidal Curve
Untitled
Model sferyczny - sześcian-ośmiościan
Descubrir recursos
Interior Angles of A Polygon
Line- Shannon McCarthy- h3b9v7
Equation cartésienne du plan
distance between Incenter and Euler line
Algebra 1
Descubre temas
Números Naturales
Funciones Logarítmicas
Romboide
Figuras planas
Números