Given f(x): Graph f'(x)
How to operate the applet

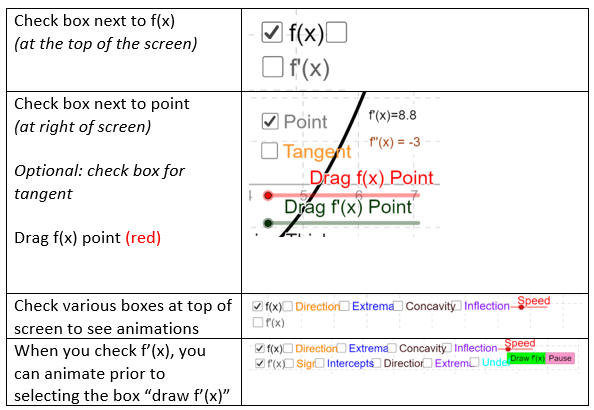
Best if used with Google Chrome or Firefox. Hit "Control" + "-" to zoom out if the app is too big for your screen. The top row corresponds to the features of the graph of f(x). Check each box to observe its features. The red speed slider causes traces to go faster, but may compromise thoroughness. The bottom row corresponds to features of the graph f'(x), the derivative of f(x). Notice how the color of the features of the graph of f'(x) correspond to the colors of the features of f(x). They are as follows:
Where f(x) is increasing (GREEN) f'(x) is positive (GREEN).
Where f(x) is decreasing (RED) f'(x) is negative (RED).
Where f(x) has extrema (BLUE) f'(x) has x-intercepts (BLUE). *This is only true for continuous, differentiable functions. In reality, wherever f(x) has a horizontal tangent, f'(x) will have an x-intercept*
Where f(x) is concave up (MAGENTA) f'(x) is increasing (MAGENTA).
Where f(x) is concave down (BROWN) f'(x) is decreasing (BROWN).
Where f(x) has inflection points (PURPLE) f'(x) has extrema (PURPLE).
You can also drag your own point and view the tangent line using the controls on the right.
Enjoy!