L8.5 - Combining Events
Learning Intentions and Success Criteria
- Calculate the probability of events using information in tables and in Venn diagrams
- Interpret Venn diagrams and tables to describe events composed of other events
- Use tables and Venn diagrams to represent sample spaces and to find probabilities

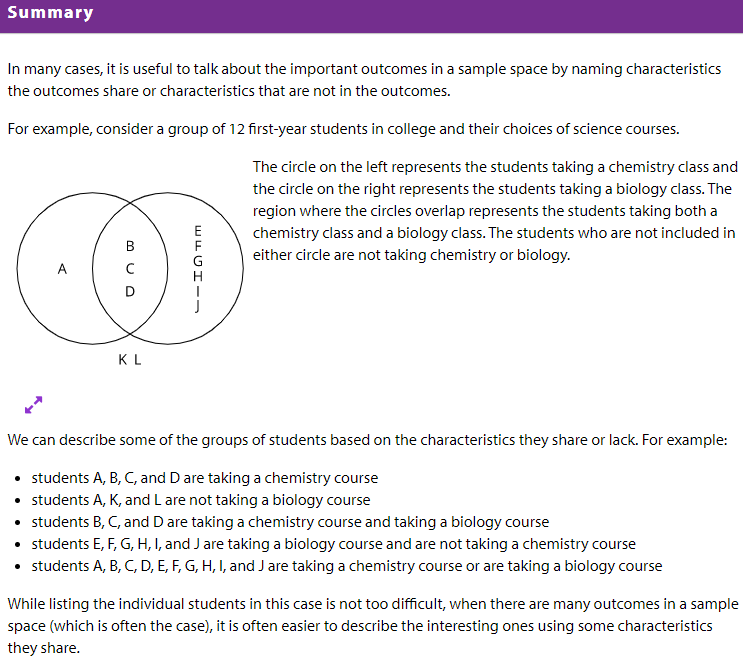
What do you notice? What do you wonder?
The small dots next to the names indicate that the name listed in the diagram is a country.
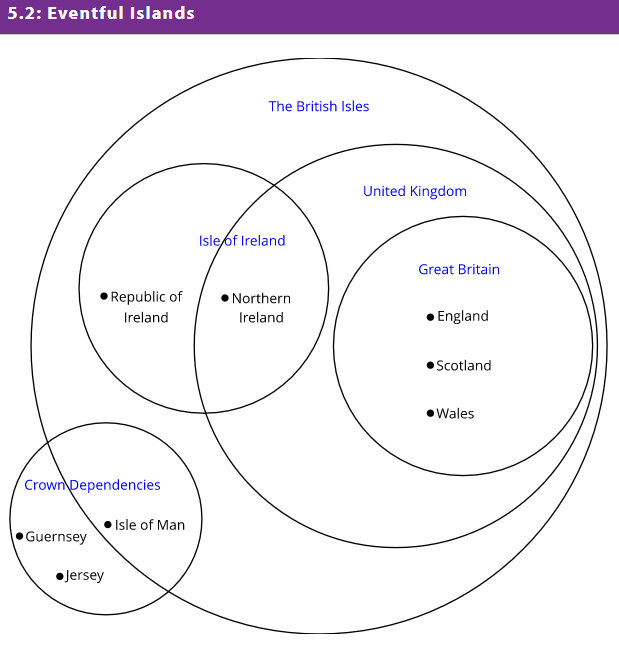
1. Based on the categories in the Venn diagram, describe Northern Ireland in a way that will not include any other countries.
2. Based on the categories in the Venn diagram, describe the Republic of Ireland in a way that will not include any other countries.
3. How many countries displayed are not part of The British Isles?
4. How many countries displayed are part of the United Kingdom?
5. How many countries displayed are part of the Island of Ireland?
6. How many places displayed are part of the United Kingdom and the Isle of Ireland?
7. How many places displayed are part of the United Kingdom or the Isle of Ireland?
8. If one of the crown dependencies (there are 3) is chosen at random, what is the probability that it is part of The British Isles?
9. Northern Ireland, England, Scotland and Wales are all part of the United Kingdom. If one of them is selected at random, what is the probability that it is also considered part of Great Britain?
10. Given that the Republic of Ireland, Northern Ireland, England, Scotland, Wales, and the Isle of Man are all part of The British Isles, what is the probability that one of them selected at random is part of the Island of Ireland?
5.3: Info Gap: College and Career Planning
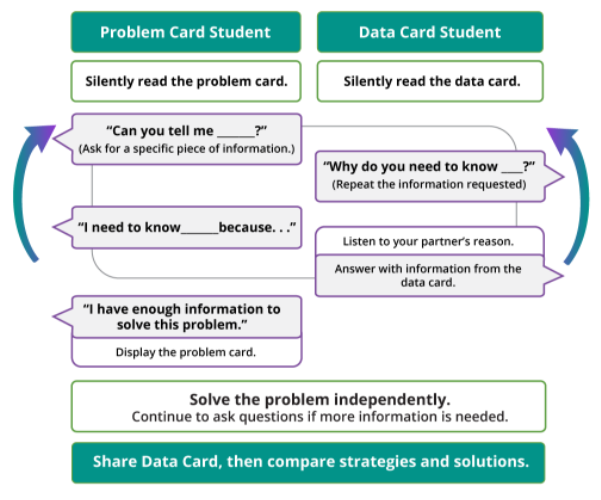
Follow the directions given. Solve the problem.
5.4: Number Cube Descriptions
b. The cubes have a 4 and a 6.
c. The cubes are doubles. (Doubles means that the number on the two number cubes is the same.)
d. The cubes are doubles and the first cube is a 6.
e. The cubes are doubles or the first cube is a 6.
f. The first cube is not a 6.
g. The cubes are doubles and the first cube is not a 6.
h. The cubes are not doubles.
3. Use the information in the table to answer the questions. a. What percentage of the rolls have a 6 on the first cube?
b. What percentage of the rolls have a 4 and a 6?
c. What percentage of the rolls are doubles?
d. What percentage of the rolls are doubles and have a 6 on the first cube?
e. What percentage of the rolls are doubles or have a 6 on the first cube?
f. What percentage of the rolls do not have a 6 on the first cube?
g. What percentage of the rolls are doubles and do not have a 6 on the first cube?
h. What percentage of the rolls are not doubles?
4. The sample space has 36 outcomes. Use this and the number of outcomes in each event to find the actual probability for each event in the previous problem. Compare your answers.
5. Why is the actual probability different from the percentage of rolls you made for each event?
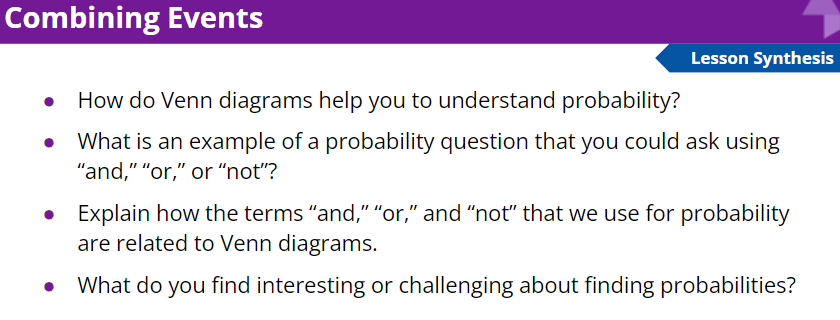
Lesson Synthesis: Combining Events
Learning Intentions and Success Criteria
- Calculate the probability of events using information in tables and in Venn diagrams
- Interpret Venn diagrams and tables to describe events composed of other events
- Use tables and Venn diagrams to represent sample spaces and to find probabilities
Cool-Down: Playing Sports
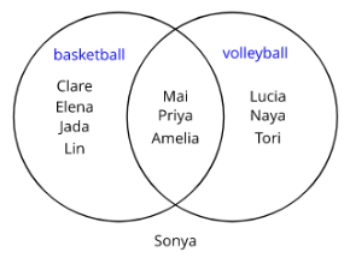
1. What is the probability that it is a student who played basketball and volleyball?
2. What is the probability that it is a student who played basketball or volleyball?
3. What is the probability that it is not a student who played volleyball?