Outline
Percent Change Visualized with Area
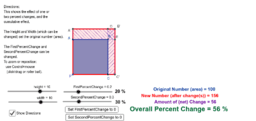
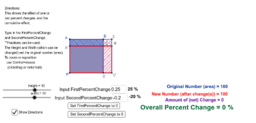
Percent change is an important concept. In these GeoGebra files one can experiment with various percent increases and decreases. One percent change and be performed or a percent change followed by another percent change. A key is the compound effect of two percent changes. You will notice, for example, that:
- a 20% increase, followed by another 20% increase is not the same as a 40% increase,
- a 20% decrease, followed by another 20% decrease is not the same as a 40% decrease,
- a 20% increase, followed by a 20% decrease does not take the number back to the original number.