Google Classroom
Google Classroom
GeoGebra
GeoGebra Classroom
Sign in
Search
Google Classroom
Google Classroom
GeoGebra
GeoGebra Classroom
Outline
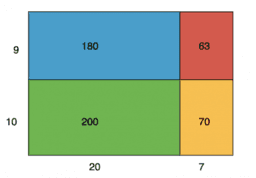
Using Diagrams to Represent Multiplication: IM 6.5.7
Lesson 6.5.7
Practice 6.5.7
Using Diagrams to Represent Multiplication: IM 6.5.7
Author:
GeoGebra Classroom Activities
,
IM 6 – 8 Math
Topic:
Arithmetic
,
Diagrams
,
Multiplication
,
Numbers
“Using Diagrams to Represent Multiplication”
from IM Grade 6 by
Open Up Resources
and Illustrative Mathematics. Licensed under the
Creative Commons Attribution 4.0 license
.
Table of Contents
Lesson 6.5.7
IM 6.5.7 Lesson: Using Diagrams to Represent Multiplication
Practice 6.5.7
IM 6.5.7 Practice: Using Diagrams to Represent Multiplication
Next
IM 6.5.7 Lesson: Using Diagrams to Represent Multiplication
New Resources
Model sferyczny - dwunastościan-dwudziestościan
အခြေခံ data အခေါ်အဝေါ်များ
Angle Addition: Warm Up Exercises
bewijs stelling van Pythagoras
Fourier Lissajous (Mechanical)
Discover Resources
Constructing a Hyperbola
marshall_harrison geogebra intro
Angle In A Semicircle
Discover Topics
Right Triangles
Interest Calculation
Fractions
Hypothesis Testing
Mode