Google Classroom
Google Classroom
GeoGebra
GeoGebra Classroom
Sign in
Search
Google Classroom
Google Classroom
GeoGebra
GeoGebra Classroom
Outline
Charts & Graphs
Bar Chart Construction
Creating a Uniform Number Scale
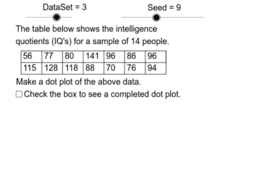
Dot Plot Construction Problems
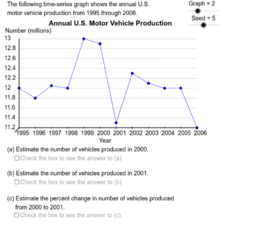
Time Series Analysis Problems
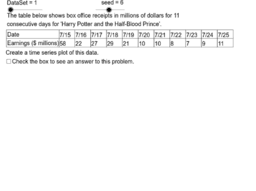
Time Series Construction Problems
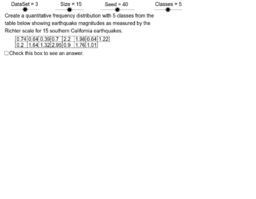
Quantitative Frequency Distribution Construction
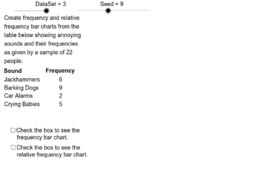
Relative Frequencies and Categorical Bar Charts
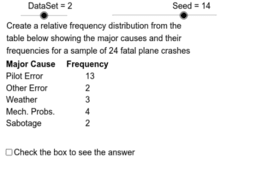
Relative Frequency Distribution Problems
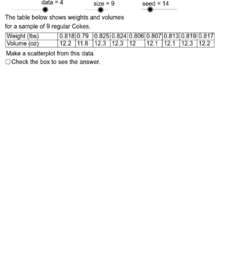
Scatter Diagram Construction Problems
Charts & Graphs
Author:
David Gurney
Topic:
Statistics
This applet contains all my applets involving charts and graphs.
Bar Chart Construction
Creating a Uniform Number Scale
Dot Plot Construction Problems
Time Series Analysis Problems
Time Series Construction Problems
Quantitative Frequency Distribution Construction
Relative Frequencies and Categorical Bar Charts
Relative Frequency Distribution Problems
Scatter Diagram Construction Problems
Next
Bar Chart Construction
New Resources
Damped Trochoidal Curve
apec
Trefoil Knot
Angle Addition: Warm Up Exercises
z`]]
Discover Resources
Probability without Replacement
Alle Grundrechenarten von kartesichen komplexen Zahlen
พื้นผิวในปริภูมิสามมิติ
Montmort Problem (Matching Problem)
각뿔의 관찰
Discover Topics
Continuity
Addition
Coordinates
Geometric Mean
Equilateral Triangles