Google Classroom
Google Classroom
GeoGebra
GeoGebra Classroom
Abrir sesión
Buscar
Google Classroom
Google Classroom
GeoGebra
GeoGebra Classroom
Esquema
M5: 14 Daten
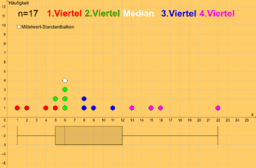
Boxplot: Datenaufteilung in Farbe
M5: 14 Daten
Autor:
Matthias Hornof
Boxplot: Datenaufteilung in Farbe
Siguiente
Boxplot: Datenaufteilung in Farbe
Nuevos recursos
Steigung und Steigungsdreieck
Die drei Gesichter der homogen linearen Funktion (Wertetabelle, Funktionsgleichung, Graph)
Match it! Graph & Term
Homogen lineare Funktionen
Alles der Steigung nach - Level 2
Descubrir recursos
extreme Kurve
M 9 reelle Zahlen Rechteck selbst zeichnen
WMS Reinach: Klassischer Fall der Mathematik
Unbenannt
Zeichnen von Strecke, Gerade, Strahl
Descubre temas
Círculo
Cilindro
Suma superior e inferior o suma de Riemann
Desviación Estándar
Cuadriláteros en general