Google Classroom
Google Classroom
GeoGebra
Classe GeoGebra
Se connecter
Chercher
Google Classroom
Google Classroom
GeoGebra
Classe GeoGebra
Contenu
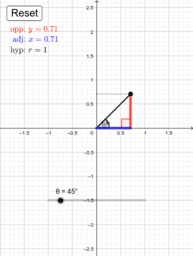
Visualisation: sin, cos, tg
Créés par auteur
Autres visualisations
Visualisation: sin, cos, tg
Auteur :
alain_mangan
Thème :
Fonctions Trigonométriques
Activités pour aider à visualiser les fonctions trigonométiques: sin(), cos(), et tg().
Table des matières
Créés par auteur
SinCosTan
Autres visualisations
Le cercle trigonométrique : sinus, cosinus et tangente.
CAST Rule
Unit Circle and Sine/Cosine Graph
The unit circle and the graphs of sin, cos & tan
Sin(x) & Unit Circle - Degrees
Sine and cosine are out of phase by 90 °
Suivant
SinCosTan
Nouvelles ressources
Révision équations et inéquations, fonctions, coniques
Chronomètre en secondes entières
Chronomètre en secondes.
Activité de découverte
Termes d'un polynôme développé réduit modifiable
Découvrir des ressources
Etude d'un lancer de poids
Variante
Outils CAS
loi binomiale : probabilités et fonction de répartition
savoir déterminer une racine évidente d'un polynôme
Découvrir des Thèmes
Intégrale Définie
Nombres Rationnels
Calcul Intégral
Équations Quadratiques
Constructions