Google Classroom
Google Classroom
GeoGebra
GeoGebra Classroom
Abrir sesión
Buscar
Google Classroom
Google Classroom
GeoGebra
GeoGebra Classroom
Esquema
Graphing for Reflections Practice
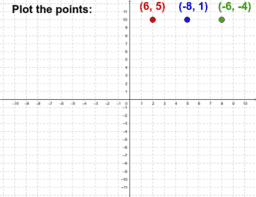
Plot Points
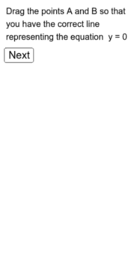
Lines representing equations of the form x = a and y = c
Graphing for Reflections Practice
Autor:
Kevin Westrich
Tema:
Simetría
Plot Points
Lines representing equations of the form x = a and y = c
Siguiente
Plot Points
Nuevos recursos
အခြေခံ data အခေါ်အဝေါ်များ
רישום חופשי
bewijs stelling van Pythagoras
Angle Addition: Warm Up Exercises
Model sferyczny - sześcian-ośmiościan
Descubrir recursos
Transformations Workspace
Tangent Sketch p.3
Posiciones Límite Grashof
이등변삼각형 의 정의(Definition of Isosceles Triangle)
lim x sin(1/x) as x approaches 0
Descubre temas
Semejanza
Cilindro
Área
Rectángulo
Suma superior e inferior o suma de Riemann