Chercher
Google ClassroomGoogle Classroom
GeoGebraClasse GeoGebra

Contour

  1. Using Histograms to Answer Statistical Questions: IM 6.8.7
    1. Lesson 6.8.7
    2. Practice 6.8.7

    Using Histograms to Answer Statistical Questions: IM 6.8.7

    Auteur :GeoGebra Classroom Activities, IM 6 – 8 Math
    Thème :Histogramme, Statistiques
    “Using Histograms to Answer Statistical Questions” from IM Grade 6 by Open Up Resources and Illustrative Mathematics. Licensed under the Creative Commons Attribution 4.0 license.
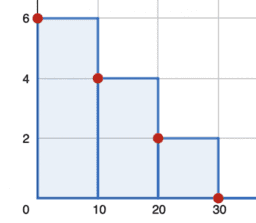
    Using Histograms to Answer Statistical Questions: IM 6.8.7

    Table des matières

    • Lesson 6.8.7

      • IM 6.8.7 Lesson: Using Histograms to Answer Statistical Questions
    • Practice 6.8.7

      • IM 6.8.7 Practice: Using Histograms to Answer Statistical Questions
    Suivant
    IM 6.8.7 Lesson: Using Histograms to Answer Statistical Questions

    Nouvelles ressources

    • Slope Between 2 Points (Phase 2)
    • Discriminant of y = ax² + bx + c
    • Transforming Random Variables
    • Graphs of Rational Expressions
    • Untitled

    Découvrir des ressources

    • Geogebra
    • 平行四辺形リンク
    • Zlati rez in Pi... piramida
    • Untitled

    Découvrir des Thèmes

    • Théorie des Ensembles
    • Quadrilatère Quelconque
    • Logarithme
    • Coordonnées
    • Probabilité Conditionnelle
    À proposPartenairesCentre d'aide
    Termes du ServicePrivéLicence
    Calculatrice GraphiqueCalculatrice SuiteRessources de la Communauté

    Téléchargez nos applications ici:

    Download_on_the_App_Store_Badge_US-UK_RGB_blk_4SVG_092917

    © 2025 GeoGebra®