Google Classroom
Google Classroom
GeoGebra
GeoGebra Classroom
Abrir sesión
Buscar
Google Classroom
Google Classroom
GeoGebra
GeoGebra Classroom
Esquema
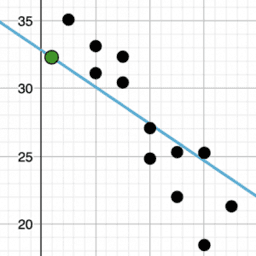
Describing Trends in Scatter Plots
Spot the Odd One out
Some more Practice
Describing Trends in Scatter Plots
Autor:
Lee McCulloch-James
,
IM 6 – 8 Math
,
GeoGebra Classroom Activities
Describing Trends in Scatter Plots Resources[/url] and Illustrative Mathematics. Licensed under the
Creative Commons Attribution 4.0 license
.
Tabla de contenidos
Spot the Odd One out
Describing Trends in Scatter Plots
Some more Practice
Describing Trends in Scatter Plots
Siguiente
Describing Trends in Scatter Plots
Nuevos recursos
Slope and Road Signs
အခြေခံ data အခေါ်အဝေါ်များ
Trefoil Knot
z`]]
¿Quién llegará más lejos en el mundial?
Descubrir recursos
rotations, reflections, translations and enlargements
When Chords Intersect in a Circle
Triangle Inequality
Cosine Rule - Guided Proof
Descubre temas
Multiplicación
Baricentro
Características estadísticas
Integral Indefinida
Secciones Cónicas