Google Classroom
Google Classroom
GeoGebra
GeoGebra Classroom
Sign in
Search
Google Classroom
Google Classroom
GeoGebra
GeoGebra Classroom
Outline
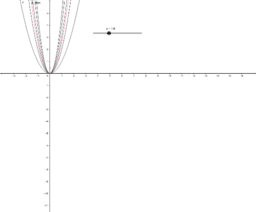
이차함수의 그래프에서 최고차항의 계수와 그래프의 폭의 관계
y=ax^2(a>0)의 그래프
y=ax^2(a<0)의 그래프
y=ax^2의 그래프
이차함수의 그래프에서 최고차항의 계수와 그래프의 폭의 관계
Author:
rlathgus4582
이차함수의 최고차항의 계수의 절댓값이 클수록 그래프의 폭이 좁아지고 y축에 가까워진다.
Table of Contents
y=ax^2(a>0)의 그래프
이차함수와 그래프의 폭1
y=ax^2(a<0)의 그래프
이차함수와 그래프의 폭2
y=ax^2의 그래프
이차함수와 그래프의 폭3
Next
이차함수와 그래프의 폭1
New Resources
교재제작용 그래프 캡처 애플릿
AI를 활용한 다항식 탐구
지오지브라 노트 사용법
행렬의 곱셈
복소수와 그 연산
Discover Resources
(조승호)두 원의 교점을 지나는 직선/원의 방정식
피타고라스정리2
덕원고 2학년 1반 26번이창욱
디지털교과서 링크모음
변화율(3)
Discover Topics
Real Numbers
Vectors
Sphere
Translation
Cylinder