Google Classroom
Google Classroom
GeoGebra
Classe GeoGebra
Se connecter
Chercher
Google Classroom
Google Classroom
GeoGebra
Classe GeoGebra
Contenu
CP Statistics
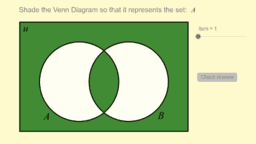
Shading Venn Diagrams (1)
CP Statistics
Auteur :
Justin Wingard
Thème :
Statistiques
Shading Venn Diagrams (1)
Suivant
Shading Venn Diagrams (1)
Nouvelles ressources
Slope Between 2 Points (Phase 2)
အခြေခံ data အခေါ်အဝေါ်များ
Model sferyczny - sześcian-ośmiościan
¿Quién llegará más lejos en el mundial?
bewijs stelling van Pythagoras
Découvrir des ressources
Symmetrical Properties of Circles
Claire Lafaye geogebra sketch unit 7
Triangle Similarity Investigation 1
House
HamlatzaPartE2b
Découvrir des Thèmes
Équations Linéaires
Loi Binomiale
Boîte à Moustaches
Résumé Statistique
Triangles