Where Are We Eating?
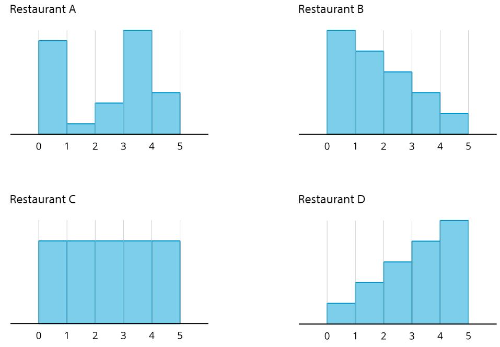
Each histogram represents the number of star ratings for a different restaurant. The ratings range from 0–4, with 0 representing a very poor experience and 4 representing an excellent experience. For each question, explain your reasoning.