Step 4 (Extra): Change color and thickness
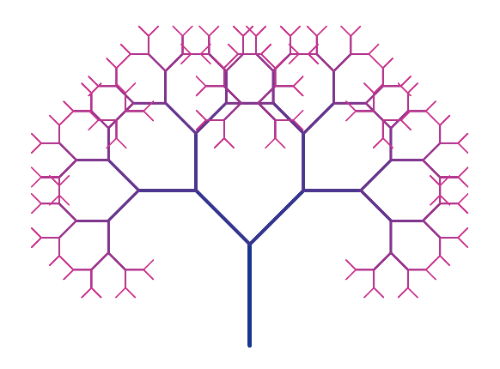
To make our tree a little more eye-catching, we can change the colors and thickness.
We can do this manually by accessing the Object properties of each level. But this task is time consuming. It is faster to do it with the following scripts.
Script Case 1: Plotted level by level
n = 9
Ln = 1...n
Execute(Zip("SetLineThickness(L"+i+", 13 - "+i+")", i, Ln))
Execute(Zip("SetDynamicColor(L"+i+", "+i+"/n, 0.21, 0.56)", i, Ln))
Case 1: Demo
Script Case 2: Plotted all levels at once
# First we need to get all elements of ListAll
n = 9
Ln = 1...n
Execute(Zip("L"+i+"=Element(ListAll, "+i+")", i, Ln))
Execute(Zip("SetLineThickness(L"+i+", 13 - "+i+")", i, Ln))
Execute(Zip("SetDynamicColor(L"+i+", "+i+"/n, 0.21, 0.56)", i, Ln))
Case 2: Demo
You can explore different colors by changing the last three values in the SetDynamicColor() command. For example, type the code below in the input box:
Execute(Zip("SetDynamicColor(L"+i+", 0.73, "+i+"/n, 0.95)", i, Ln))
Or this one:
Execute(Zip("SetDynamicColor(L"+i+", 0.12, 0.73, "+i+"/n)", i, Ln))
Remark: For more details about the commands used here follow the links below: