Google Classroom
Google Classroom
GeoGebra
GeoGebra Classroom
Anmelden
Suche
Google Classroom
Google Classroom
GeoGebra
GeoGebra Classroom
Kapitel
Intro to Stats
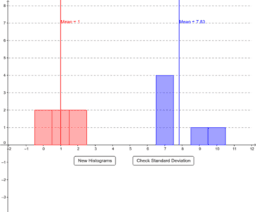
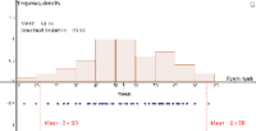
AQR Section 17: Which Histogram has more Variation?
Histograms, mean and standard deviation
Intro to Stats
Autor:
Ms. Melanie Kachinsky
AQR Section 17: Which Histogram has more Variation?
Histograms, mean and standard deviation
Weiter
AQR Section 17: Which Histogram has more Variation?
Neue Materialien
Nikmati Keunggulan Di Bandar Judi Terpercaya
Cartesian vs Polar
Rose Curve
Viviani's Curve
Trefoil Knot
Entdecke Materialien
dsfsfs
TR (SAMSUN) - Ομάδα πέντε κύκλων
Tarea Cálculo
Bài tập 7b trang 54
Substitutos Perfeitos
Entdecke weitere Themen
Strecke
Kegelschnitte
Sekante
Parabel
Median