Hledat
Google Classroom
GeoGebraGeoGebra Třída

Osnova

  1. Using Diagrams to Represent Addition & Subtraction: IM 6.5.2
    1. Lesson 6.5.2
    2. Practice 6.5.2

    Using Diagrams to Represent Addition & Subtraction: IM 6.5.2

    Autor:GeoGebra Classroom Activities, IM 6 – 8 Math
    Téma:Sčítání, Aritmetika, Čísla, Odčítání
    “Using Diagrams to Represent Addition and Subtraction” from IM Grade 6 by Open Up Resources and Illustrative Mathematics. Licensed under the Creative Commons Attribution 4.0 license.
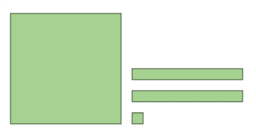
    Using Diagrams to Represent Addition & Subtraction: IM 6.5.2

    Obsah

    • Lesson 6.5.2

      • IM 6.5.2 Lesson: Using Diagrams to Represent Addition and Subtraction
    • Practice 6.5.2

      • IM 6.5.2 Practice: Using Diagrams to Represent Addition and Subtraction
    Další
    IM 6.5.2 Lesson: Using Diagrams to Represent Addition and Subtraction

    Nové materiály

    • Graph Segment of f(x) = x in Polar Coordinates
    • အခြေခံ data အခေါ်အဝေါ်များ
    • apec
    • Graphing a Circle in Polar Coordinates
    • Nikmati Keunggulan Di Bandar Judi Terpercaya

    Objevujte materiály

    • Unit Circle Definitions of Sin, Cos, Tan
    • circulaire_uniforme
    • Acute Triangle
    • Midpoint Worksheet
    • Zadatak9
    • Martillo

    Objevte témata

    • Obsah
    • Parabola
    • Pravděpodobnost
    • Lineární rovnice
    • Otočení
    InformacePartneřiHelp centrum
    Podmínky použitíSoukromíLicence
    Grafický kalkulátorSada prostředíVýukové materiály

    Zde stáhnete naše aplikace:

    Download_on_the_App_Store_Badge_US-UK_RGB_blk_4SVG_092917

    © 2025 GeoGebra®