Google Classroom
Google Classroom
GeoGebra
GeoGebra Classroom
Abrir sesión
Buscar
Google Classroom
Google Classroom
GeoGebra
GeoGebra Classroom
Esquema
Correlation Coefficient Discovery Graphs
Discovering Correlation Coefficient Scatter Plots
Correlation Coefficient Discovery Graphs
Autor:
ShawnFowers
Tema:
Correlación
,
Estadística
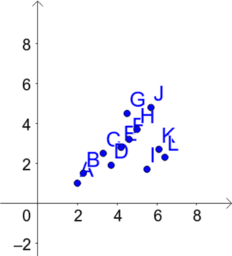
Group of graphs to be used in conjunction with Correlation Coefficient Discovery lesson.
Discovering Correlation Coefficient Scatter Plots
Siguiente
Discovering Correlation Coefficient Scatter Plots
Nuevos recursos
Angle Addition: Warm Up Exercises
Untitled
Viviani's Curve
Trefoil Knot
רישום חופשי
Descubrir recursos
Trig. ADR.
Circumcenter
Comparación derivadas 2
Fibonacci's spiral
Diameters & Chords
Descubre temas
Volumen
Cuadrado
Segmento Mediana
Programación Lineal
Características estadísticas