Google Classroom
Google Classroom
GeoGebra
GeoGebra Classroom
Abrir sesión
Buscar
Google Classroom
Google Classroom
GeoGebra
GeoGebra Classroom
Esquema
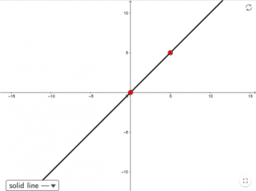
Graphing Linear Inequalities in Two Variables 1:IM Alg1.2.21
Alg1.2.21 Lesson
Alg1.2.21 Practice
Graphing Linear Inequalities in Two Variables 1:IM Alg1.2.21
Autor:
GeoGebra Classroom Activities
Tema:
Álgebra
,
Inecuaciones
,
Estadística
“Graphing Linear Inequalities in Two Variables (Part 1)”
from IM Algebra I © 2019
Illustrative Mathematics
. Licensed under the
Creative Commons Attribution 4.0
license.
Tabla de contenidos
Alg1.2.21 Lesson
IM Alg1.2.21 Lesson: Graphing Linear Inequalities in Two Variables (Part 1)
Alg1.2.21 Practice
IM Alg1.2.21 Practice: Graphing Linear Inequalities in Two Variables (Part 1)
Siguiente
IM Alg1.2.21 Lesson: Graphing Linear Inequalities in Two Variables (Part 1)
Nuevos recursos
bewijs stelling van Pythagoras
Model sferyczny - dwunastościan-dwudziestościan
Slope and Road Signs
Damped Trochoidal Curve
အခြေခံ data အခေါ်အဝေါ်များ
Descubrir recursos
Angle in a semi-circle
Exercice 1 (2)
בניית ריבועים על צלעותיו של משולש ישר זווית
Tweety Bird
The Fourier Transform
Visualizing Lines of Symmetry
Descubre temas
Puntos Notables
Media Aritmética
Vectores 2D (dos dimensiones)
Cuadriláteros
Gráfico de Barras