Google Classroom
Google Classroom
GeoGebra
GeoGebra Classroom
Log ind
Søg
Google Classroom
Google Classroom
GeoGebra
GeoGebra Classroom
Opsummering
Estadística
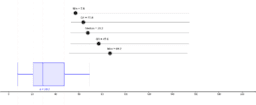
Boxplot Tool - Five Number Summary (0 to 200)
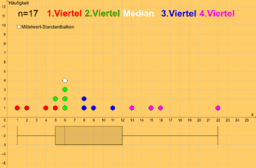
Boxplot: Datenaufteilung in Farbe
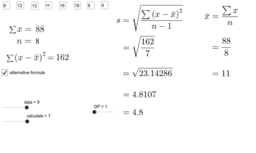
Standard Deviation Formulae
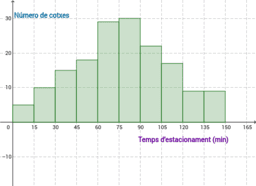
Histograma: Temps d'estacionament de cotxes en un aparcament
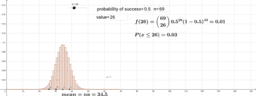
binomial distribution
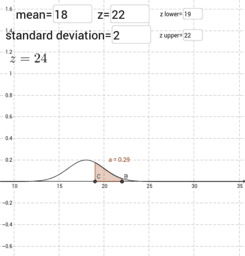
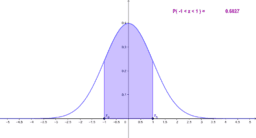
normal distribution
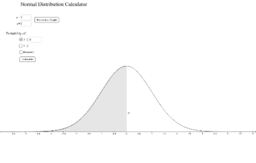
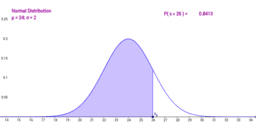
Normal Distrubution Calculator
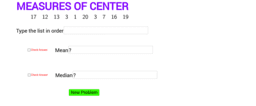
Measures of Center
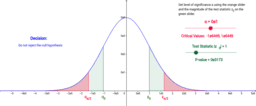
Hypothesis Test: Two-Tail, Normal Distribution
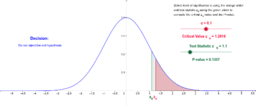
Hypothesis Test: Right Tail, Normal Distribution
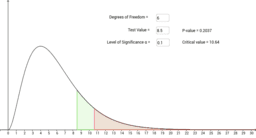
Chi Squared worksheet
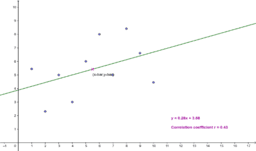
Linear Regression & Correlation Worksheet
Standard Normal Distribution
Normal Distribution Worksheet (Left Tail)
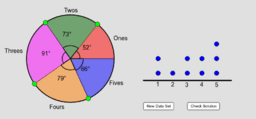
AQR Section 16: Matching a Pie Chart to a Dot Plot
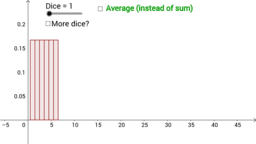
Probability distribution of dice
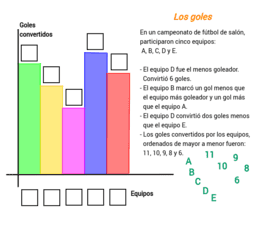
Estadística - Los goles
Chi2-test med 1 frihedsgrad
Correlation
Scatter Slider : Correlation & Line of Best Fit
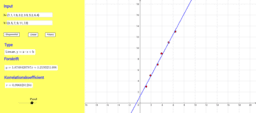
Lineær regression
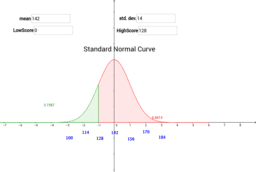
Normal Distribution: mean, std.dev.
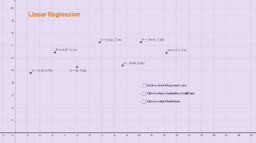
Linear Regression
normal curves and much more
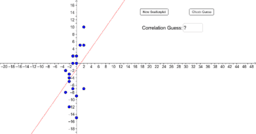
Guess the Correlation!
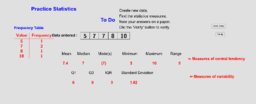
Practicing Statistical Calculation
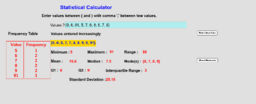
Statistical Calculator
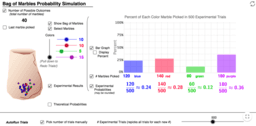
Bag of Marbles
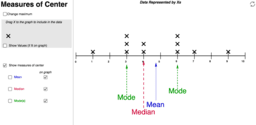
Measures of Center - Dot Plot
Association/Correlation of Variables on a Scatterplot
Estadística
Forfatter
Cristina Masotta
Boxplot Tool - Five Number Summary (0 to 200)
Boxplot: Datenaufteilung in Farbe
Standard Deviation Formulae
Histograma: Temps d'estacionament de cotxes en un aparcament
binomial distribution
normal distribution
Normal Distrubution Calculator
Measures of Center
Hypothesis Test: Two-Tail, Normal Distribution
Hypothesis Test: Right Tail, Normal Distribution
Chi Squared worksheet
Linear Regression & Correlation Worksheet
Standard Normal Distribution
Normal Distribution Worksheet (Left Tail)
AQR Section 16: Matching a Pie Chart to a Dot Plot
Probability distribution of dice
Estadística - Los goles
Chi2-test med 1 frihedsgrad
Correlation
Scatter Slider : Correlation & Line of Best Fit
Lineær regression
Normal Distribution: mean, std.dev.
Linear Regression
normal curves and much more
Guess the Correlation!
Practicing Statistical Calculation
Statistical Calculator
Bag of Marbles
Measures of Center - Dot Plot
Association/Correlation of Variables on a Scatterplot
Næste
Boxplot Tool - Five Number Summary (0 to 200)
Nye Materialer
Rose Curve
גיליון אלקטרוני להעלאת נתוני בעיה ויצירת גרף בהתאם
Model sferyczny - sześcian-ośmiościan
Cartesian vs Polar
Some random function
Opdag Ressourcer
Mckinney, Tyler Contruct a segment and its copy.
Teorema Torricelli Concurență.
Transformations of Trig Graphs
Zlati rez, trikotnik
Udforsk emner
Logaritme
Parallelogram
Sandsynlighed
Statistik
Trapez