Quadratic Functions
Quadratic Basics
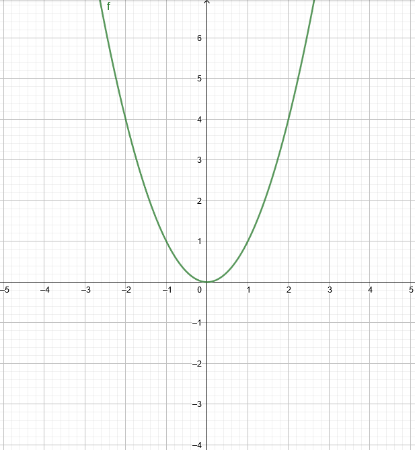
The parent function for the family of quadratics is the function:
The parent equation has a simple graph. Its graph is shown below, and the shape the equation makes is called a parabola.
The elementary quadratic function is of the form:
The values of a, h, and k in the elementary function above can bet set to any real number value. In fact, with only these three customizable values can all two-dimensional parabolic functions be obtained:
But wait! Wasn't the general form of a quadratic equation ? The equations that have the form on the left are indeed parabolas. Each and every equation of that form can be algebraically manipulated to be of the form by using a process called completing the square. You'll need to know how to convert one of the two forms into the other, so review a module about completing the square if you need a refresher.
The form is called vertex form because the vertex of the parabola is explicitly stated in the equation and has the coordinates (h,k). Vertex form is advantageous for graphing parabolas by hand and for customizing parabolas by hand to manually fit gathered data.
The form is called standard form. Standard form equations are easier to algebraically manipulate, (and their derivative can arguably be taken more easily), but forget about manually graphing them or customizing them with ease without converting to vertex form.
Vertical Stretching
The value of a in the elementary quadratic function plays the role of the vertical stretch value (or the vertical dilation scale factor). If a=2, for example, every point on the parent parabola would be moved vertically to twice its original height. The visual effect of such an alteration is such that the parabola is stretched upwards.
Interestingly, there is no need for a horizontal stretch factor, as any horizontal stretch of a parabola can be achieved through a vertical squeeze.
Use the applet below to view how the parabola f(x)=ax^2 changes as you change a using the slider. Then answer in your mind the following questions below:
1. What happens to the shape of the parabola when a is a very small positive number (e.g. 0.02)?
2. What happens to the shape of the parabola when a is negative?
3. What happens to the shape of the parabola if a is zero? Is it still a parabola?
4. What value of a forces the parabola to pass through the indicated point P?
5. If given an arbitrary point Q anywhere in the 2D plane, could a be altered so that the parabola passes through Q?
Horizontal Shifts
The value of h in the elementary quadratic function plays the role of the horizontal shift value. In conjunction with the vertical shift value, the vertex of the parabola (and the rest of the parabola, too) can be translated to any desired point in the 2D plane. An h value of 3 would shift a parabola to the right three units.
 Use the applet below to watch how the parent parabola is horizontally shifted as you change the value of h by using the slider. Pay close attention to the nuance in the subtraction of h from x in the quadratic equation. Then, use the applet to answer the following questions in your mind:
1. What value of h will shift the parent parabola so that the vertex is on point P?
2. What is the equation for the parabola you made in question 1 that has its vertex on point P?
3. Given that h=0, and assuming that k could be any real number, on which line must the vertex of such a parabola lie?
4. On which vertical line would the vertex of a parabola lie if its h value was -5?
5. What values for h and k would force the vertex of a parabola to lie on the point (-3,7)? What would be an equation of such a parabola?
Use the applet below to watch how the parent parabola is horizontally shifted as you change the value of h by using the slider. Pay close attention to the nuance in the subtraction of h from x in the quadratic equation. Then, use the applet to answer the following questions in your mind:
1. What value of h will shift the parent parabola so that the vertex is on point P?
2. What is the equation for the parabola you made in question 1 that has its vertex on point P?
3. Given that h=0, and assuming that k could be any real number, on which line must the vertex of such a parabola lie?
4. On which vertical line would the vertex of a parabola lie if its h value was -5?
5. What values for h and k would force the vertex of a parabola to lie on the point (-3,7)? What would be an equation of such a parabola?Vertical Shifts
The value of k in the elementary quadratic function plays the role of the vertical shift value (or the vertical translation value). A k value of 6 would shift the vertex of a parabola (and the rest of the parabola, too) directly upwards three units.
Use the applet below to watch how the parent parabola is vertically shifted as you change the value of h using the slider. Then answer the following questions in your mind:
1. What value of k will shift the parent parabola so that the vertex lies point P?
2. What is the equation for the parabola obtained in question 1?
3. What value of k would force the parabola to pass through point Q?
4. On which horizontal line would the vertex most certainly lie if k=-4?
Conclusion
Finally, observe the set of data points in the applet below. Before using the sliders to customize the parabola , do the following:
1. Estimate as well as you can the coordinates of the vertex of the best model parabola for the data. What values of h and k come from your vertex estimate?
2. Estimate the vertical stretch value necessary to best model the data with your parabola.
Now that you have estimated the values of a, h, and k, use the sliders to graph your estimated parabola. Use the scroll bar to scroll past the list of points to see the sliders and the equation in the list on the left hand side. Did your estimation fit the data well? If it did not fit the data well, what about your estimate was not chosen well? Use the sliders to determine a better estimate if necessary.