Suche
GeoGebra
  • Startseite
  • Materialien
  • Profil
  • Classroom
  • Apps herunterladen

Diagrammes en bâtons

Autor:classespeinal
Thema:Diagramme
On utilise un repère gradué et on place une barre verticale (un bâton) dont la longueur est proportionnelle à l'effectif représentée. 
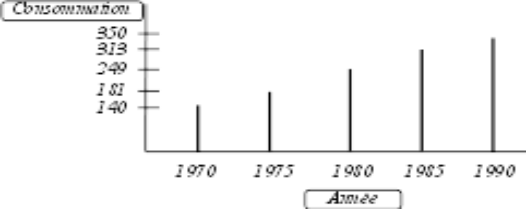
Exemple: Représenter la consommation d'électricité en fonction de l'année.
Année19701975198019851900
Consommation (en milliards de kWh)140181249313350
Image

Neue Materialien

  • Activité - Squelette d'un cube
  • Scan to show a conic related to d, F, e.
  • Correction du TP "Aire d'un quadrilatère"
  • Chronomètre en secondes.
  • Traceur+tangentes+ajustement

Entdecke Materialien

  • construction 2 fonction expo
  • Point d'intersection ou parallèlisme
  • Calcul de l'impot en 2020/ Fonction affine par morceaux
  • Fonctions trigonométriques
  • Apprendre la calculatrice scientifique

Entdecke weitere Themen

  • Pythagoras oder Satz des Pythagoras
  • Quader
  • Prisma
  • Differentialrechnung
  • Tangens
InfoPartnerHilfe-Center
NutzungsbedingungenPrivatsphäreLizenz
GrafikrechnerRechner SuiteMathe-Materialien

Lade unsere Apps hier herunter:

Download_on_the_App_Store_Badge_US-UK_RGB_blk_4SVG_092917

© 2026 GeoGebra®