Google Classroom
Google Classroom
GeoGebra
GeoGebra Classroom
Sign in
Search
Google Classroom
Google Classroom
GeoGebra
GeoGebra Classroom
Outline
Beschreibende Statistik
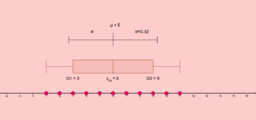
Vergleich statistischer Kennzahlen der Lage bzw. Streuung
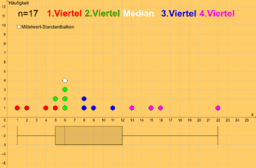
Boxplot: Datenaufteilung in Farbe
Beschreibende Statistik
Author:
Gabriele Jauck
Topic:
Statistics
Vergleich statistischer Kennzahlen der Lage bzw. Streuung
Boxplot: Datenaufteilung in Farbe
Next
Vergleich statistischer Kennzahlen der Lage bzw. Streuung
New Resources
Erdbeeren pflücken mit Maria
Vom Graphen zum Funktionsterm
Homogen lineare Funktionen
Funktion gesucht!
outfitkeuze
Discover Resources
Bsp. 498 b kont. exp. Wachstum / tm 8.KL
Ahsebrücke
Markovketten und stationäre Zustände
Quader_152/5b_2
Bruchteil als Volumen
Discover Topics
Conditional Probability
Conic Sections
Definite Integral
LCM and GCD
Similar Triangles