1. Visualization of a numerical method for determining the type of extrema of functions with two variables on a contour map without using derivatives
For the function f(x,y) with two variables on a contour map, a numerical method is proposed to determine the nature of the extrema without using the derivatives.
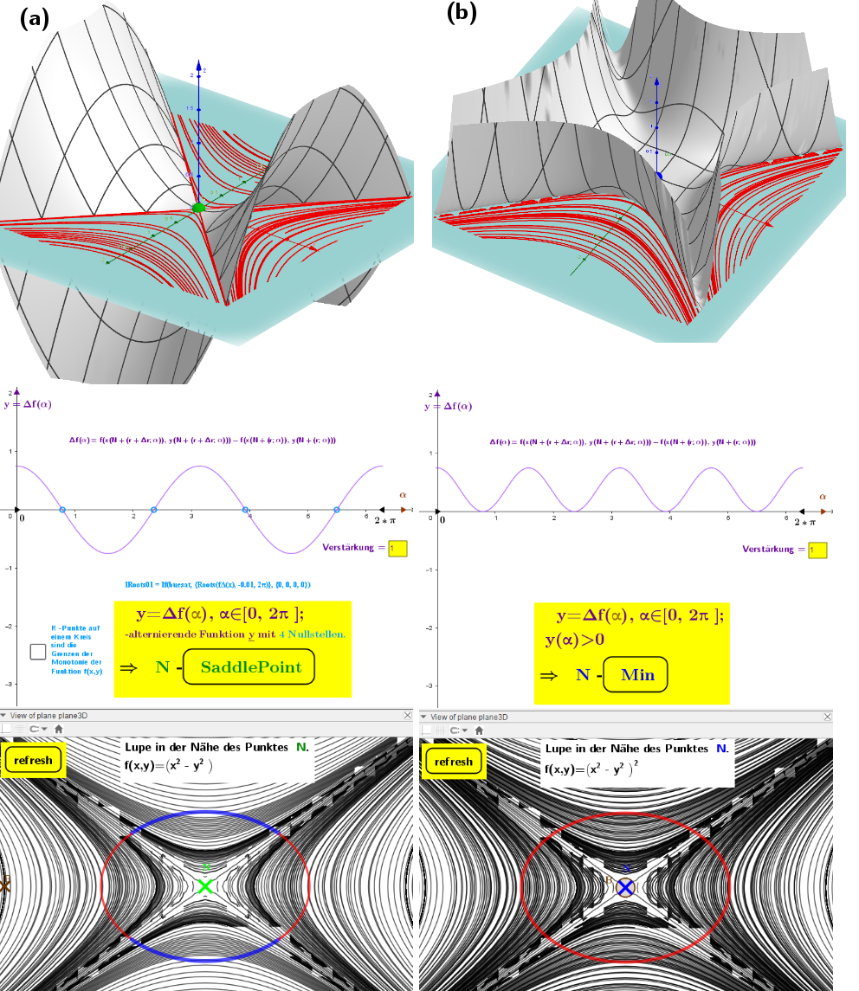
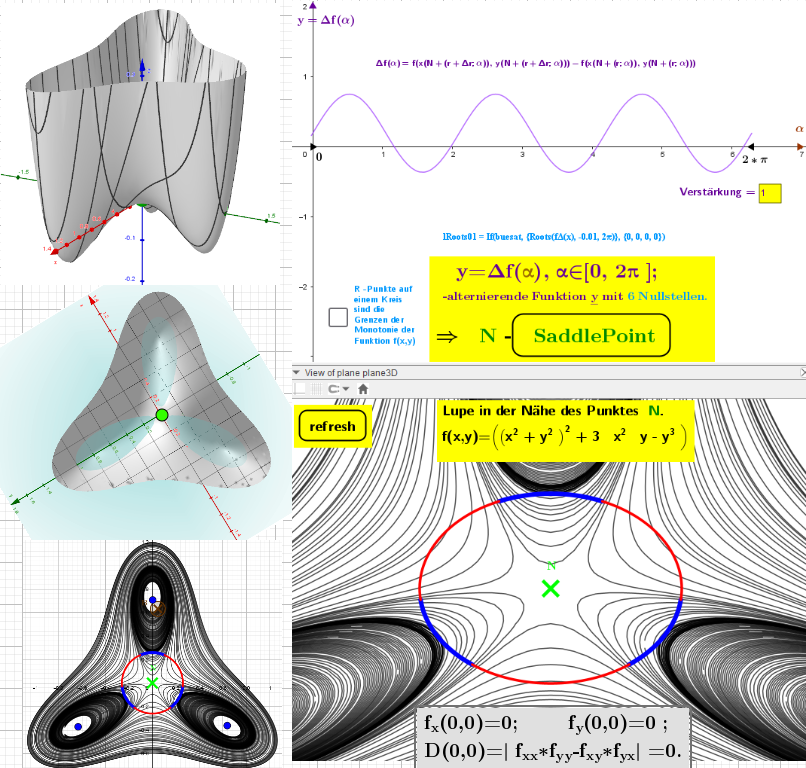
The analysis is based on the composite function Δf(α) - changes of the function f(x,y) for the corresponding points on the circles (r; α) and (r+Δr; α). The applet determines areas of monotonic increase or decrease for the analyzed function f(x,y) on a test circle that is described around a critical point on the contour map.
✱If Δf(α)<0 for α∈[0,2 π ], then f(x,y) decreases at the ends of the radii r and r+Δr of the circles (for each α), i.e. there is a local maximum at their center.
✱If Δf(α)>0 for α∈[0,2 π ], then f(x,y) increases at the ends of the radii r and r+Δr of the circles (for each α), i.e. there is a local minimum at their center.
✱If Δf(α) for α∈[0,2 π ], is an alternating function with zeros (in the color "Deep Sky Blue"), then f(x,y) has increasing and decreasing function intercepts at the edges of these circles, i.e. there is a saddle point in the center of these circles. Near this point, the surface has the shape of a saddle around the critical point: - concave upwards in one direction, - concave downwards in another direction.
 *The applet offers the possibility to check the accuracy of these calculations by tracing (button - "Trace On") the calculated monotonicity limits.
**In case index=1 it is possible to enter functions from the input box.
***Further improvements of the described method can be found in the applet.
*The applet offers the possibility to check the accuracy of these calculations by tracing (button - "Trace On") the calculated monotonicity limits.
**In case index=1 it is possible to enter functions from the input box.
***Further improvements of the described method can be found in the applet.
*The applet offers the possibility to check the accuracy of these calculations by tracing (button - "Trace On") the calculated monotonicity limits.
**In case index=1 it is possible to enter functions from the input box.
***Further improvements of the described method can be found in the applet. A detailed solution of the problem for the case index=10 according to the above diagram is discussed in detail in the Calculus "What are the extrema and saddle points of f(x,y)=xy(1-x-y)?
Function graphs (index=3) with the same contour plot: f(x,y)=(x²-y²)ᴷ for k=1 and k=2
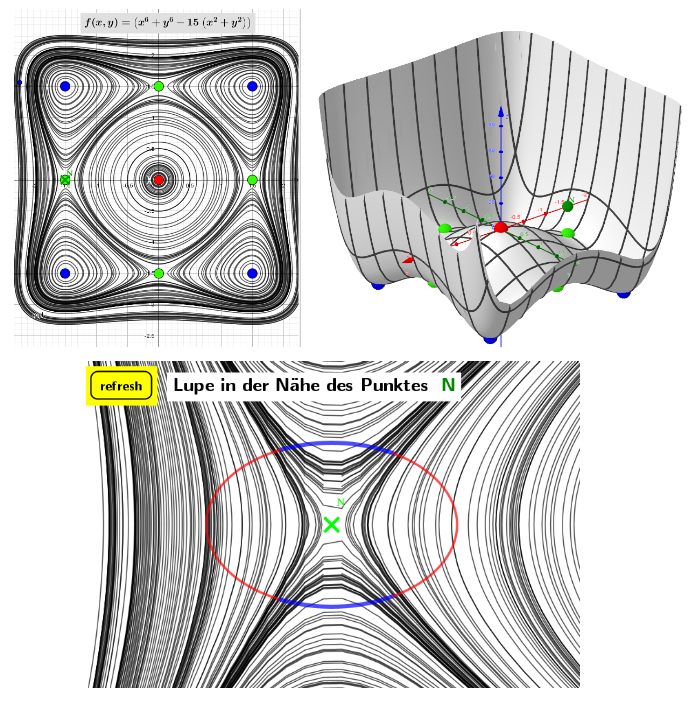
Example (index=7): f(x,y)=x⁶+y⁶-15(x²+y²)
Example (index=8): f(x,y)=3(1-x²) exp(-(x-0.5)²-(y+1)²)-2(0.2x-x³-y⁵)exp(-x²-y²)sin(x-y)
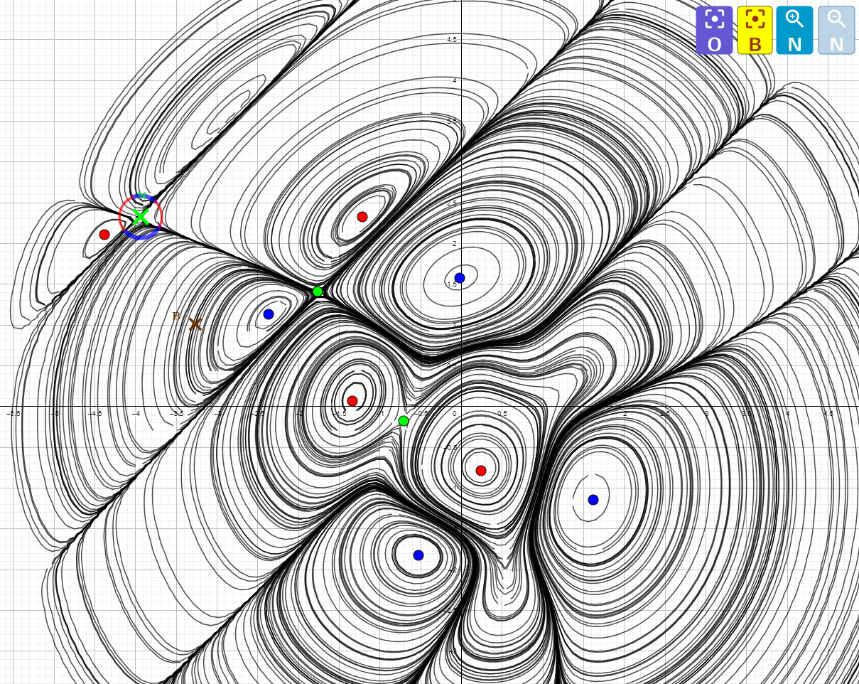
Example (index=9): Is N a saddle point?
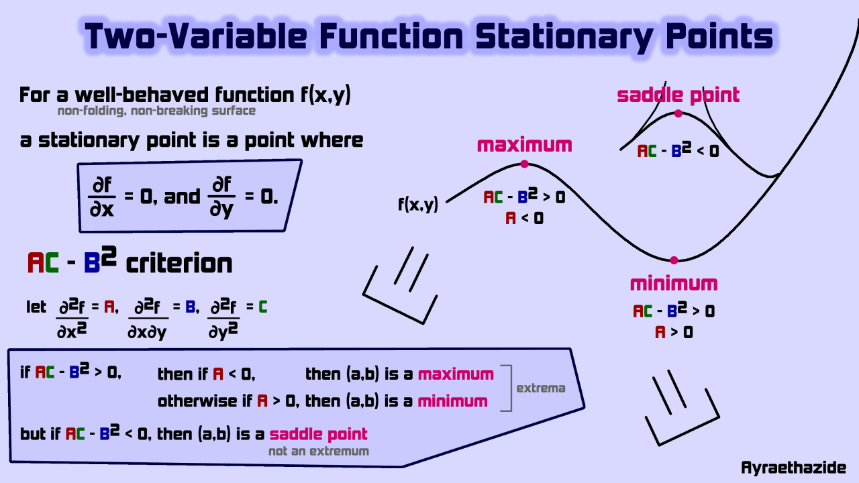
Scheme for the calculation of the stationary points of the 2-variable function