Radio Wave Intensity
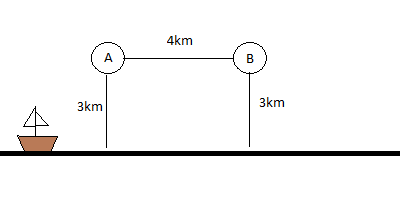
Two coherent Radio waves of wavelength 1km are transmitted from points A and B in all directions, where A and B are points at the top of radio towers which are 4km apart.
Draw an intensity of signal graph for a ship passing parallel to AB at a constant distance of 3km from AB.
Stop and try to sketch the intensity graph.
PROMPT QUESTIONS
What can you say about the difference in the distances to the two towers when the signals are perfectly in phase?
What can you say about the difference in the distances to the two towers when the signals are anti-phase?
How many peaks will there be?
How many points of zero intensity?
Using the interactivity
The green line below models the superposition of the coherent radio waves at time t.
Use the Play/Pause button and the Trace function to see if your sketch for intensity was correct.
The red line introduces the inverse square law of transmission decay, in what ways does this change the model regarding areas of "poor reception"?