Linear motion (Calculus)
Explore the premise of classic AP Calculus AB prompt: "A particle moves along the x-axis..."

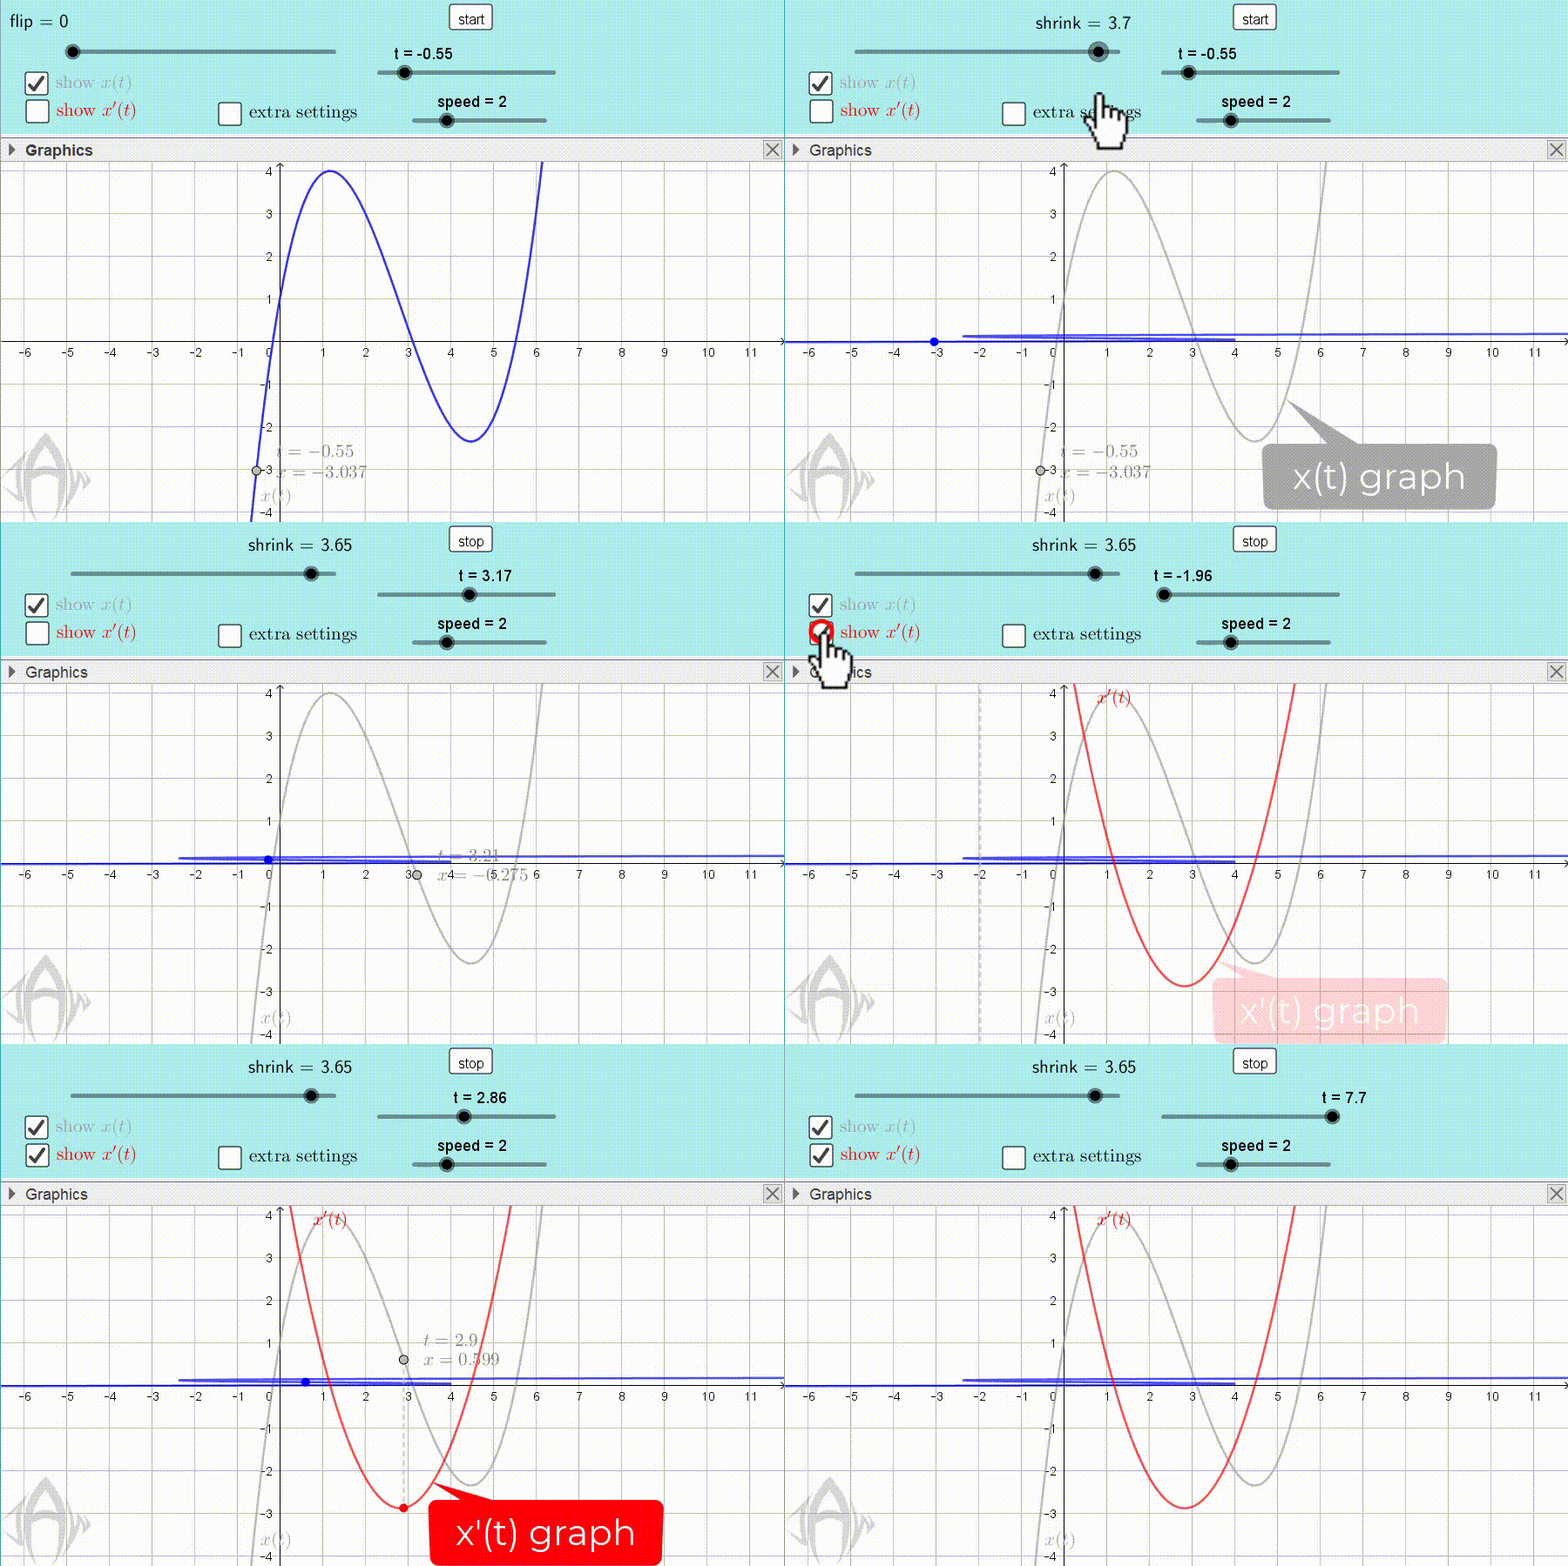
In the GeoGebra construction below, you're provided an x(t) curve that models such particle linear motion, with the horizontal axis representing time t and the vertical axis representing position x. Drag the "flip/shrink/flat" slider to transform the curve so that it lies flattened along the x-axis.
Now you also see a blue curve that represents the same particle motion, but in this case the horizontal axis represents position x. I recommend stopping the slider just shy of the end so that the curve is not completely flat, and you can better see the left/right motion of the blue particle/point.
To get the particle moving, either: (1) Press the "start" button, (2) Drag the "t" slider, or (3) Drag the grey point along the x(t) curve. Study how the motion of the grey point on the x(t) curve correlates to the motion of the blue point along the horizontal x-axis.
Check the "show x'(t)" box to display the velocity curve. Optionally, you may want to uncheck the "show x(t)" box to hide the position curve and reduce screen clutter. If you haven't already started the particle animation, press the "start" button. Study how the motion of the red point on the x'(t) curve correlates to the motion of the blue point along the horizontal x-axis. Alter the "speed" slider to change how fast the animation plays.
Check "extra settings":
The "degree" slider allows x(t) to be a polynomial of different degree. As long as "show x(t)" is also checked, you will see grey Xs in the graphics region. Drag the grey Xs up/down to change the shape of the x(t) curve. Drag the "spacing" slider to alter how far apart horizontally the grey Xs are.
Drag the "shrink-to-flat" slider to alter how high above/below the horizontal axis the blue curve is before it falls completely flat when dragging to the end of the "flip/shrink/flat" slider.