L5.5 - Scaling and Unscaling
Learning Intentions and Success Criteria
- Describe (using words and other representations) the relationships between scale factors and areas using square root graphs and calculations.
- Use square root graphs and do calculations to interpret the relationships between scale factors and areas.
5.1: Transamerica Building

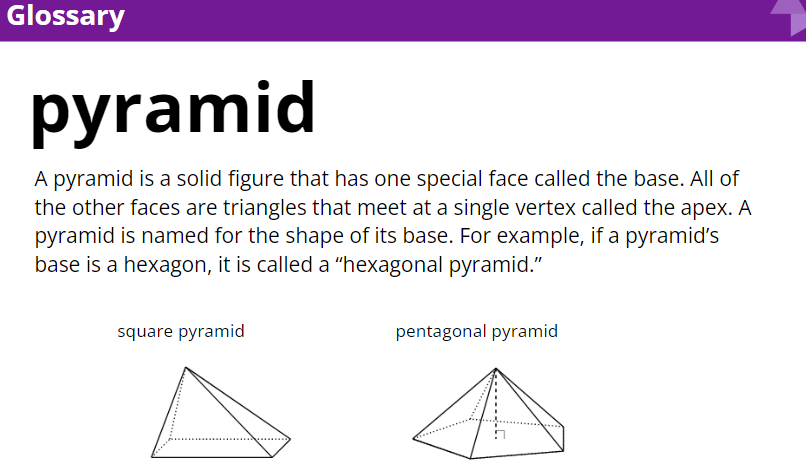
The image shows the Transamerica Building in San Francisco. It’s shaped like a pyramid. The bottom floor of the building is a rectangle measuring approximately 53 meters by 44 meters. The top floor of the building is a dilation of the base by scale factor k = 0.32. Ignoring the triangular “wings” on the sides, what is the area of the top floor? Explain or show your reasoning.
5.2: Two Viewpoints
A triangle has area 100 square inches. It’s dilated by a factor of k = 0.25. Mai says, “The dilated triangle’s area is 25 square inches.” Lin says, “The dilated triangle’s area is 6.25 square inches.” 1. For each student, decide whether you agree with their statement. If you agree, explain why. If you disagree, explain what the student may have done to arrive at their answer. Mai
Lin
2. Calculate the area of the image if the original triangle is dilated by each of these scale factors: a. k = 9
b. k = 3/4
5.3: Graphing Areas and Scale Factors
An artist painted a 1 foot square painting. Now she wants to create more paintings of different sizes that are all scaled copies of her original painting. The paint she uses is expensive, so she wants to know the sizes she can create using different amounts of paint. 1. Suppose the artist has enough paint to cover 9 square feet. If she uses all her paint, by what scale factor can she dilate her original painting?
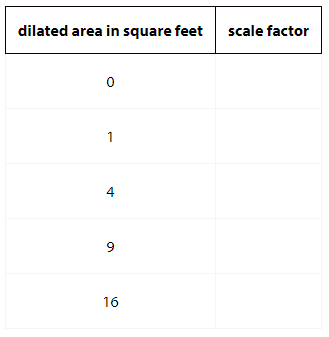
Complete the table that shows the relationship between the dilated area (x) and the scale factor (y). Round values to the nearest tenth if needed. Use the applet at the end of the lesson to help, if you choose.
3. Plot the points from the table and connect them with a smooth curve.
4. Use your graph to estimate the scale factor the artist could use if she had enough paint to cover 12 square feet.
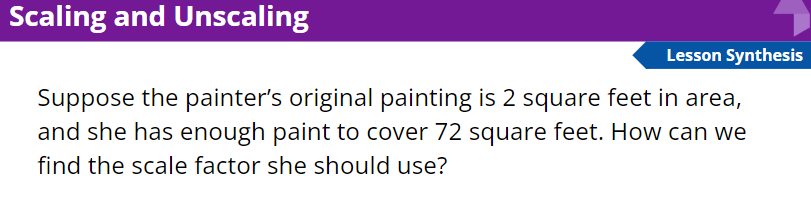
5. Suppose the painter has enough paint to cover 1 square foot, and she buys enough paint to cover an additional 2 square feet. How does this change the scale factor she can use?
6. Suppose the painter has enough paint to cover 14 square feet, and she buys enough paint to cover an additional 2 square feet. How does this change the scale factor she can use?
Learning Intentions and Success Criteria
- Describe (using words and other representations) the relationships between scale factors and areas using square root graphs and calculations.
- Use square root graphs and do calculations to interpret the relationships between scale factors and areas.