Entrar no sistema
Pesquisar
GeoGebra
Início
Materiais
Perfil
Tarefa
Baixar Aplicativos
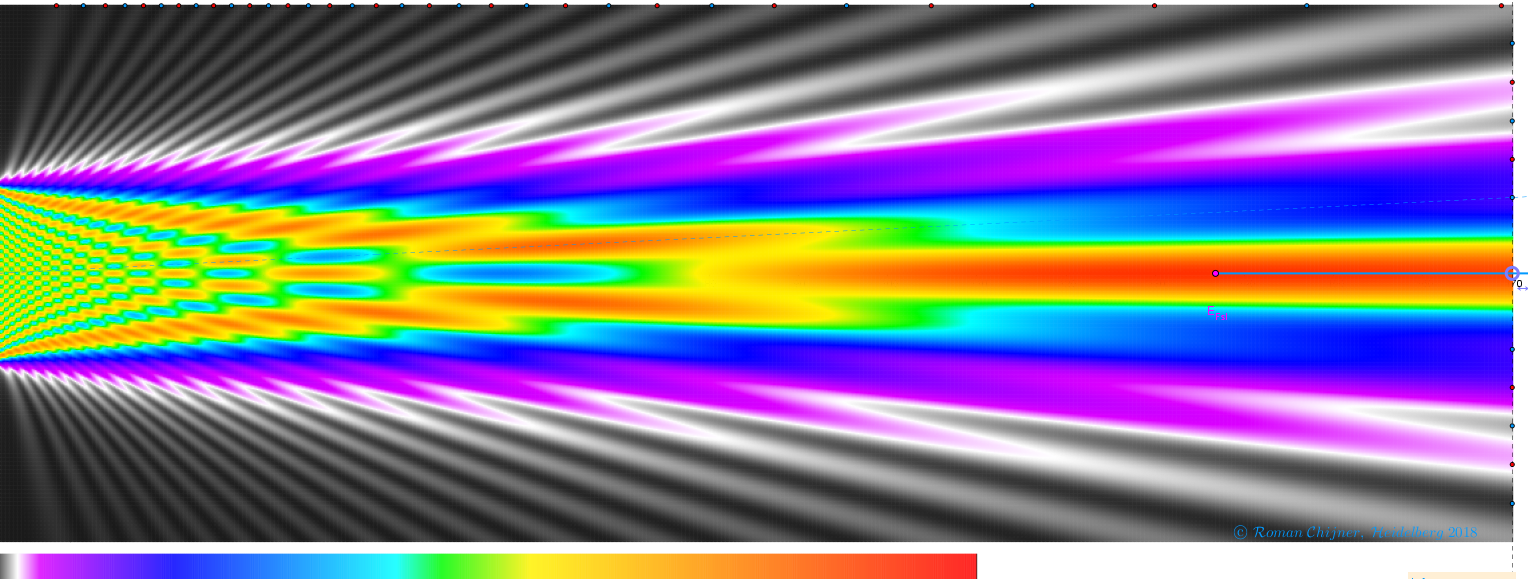
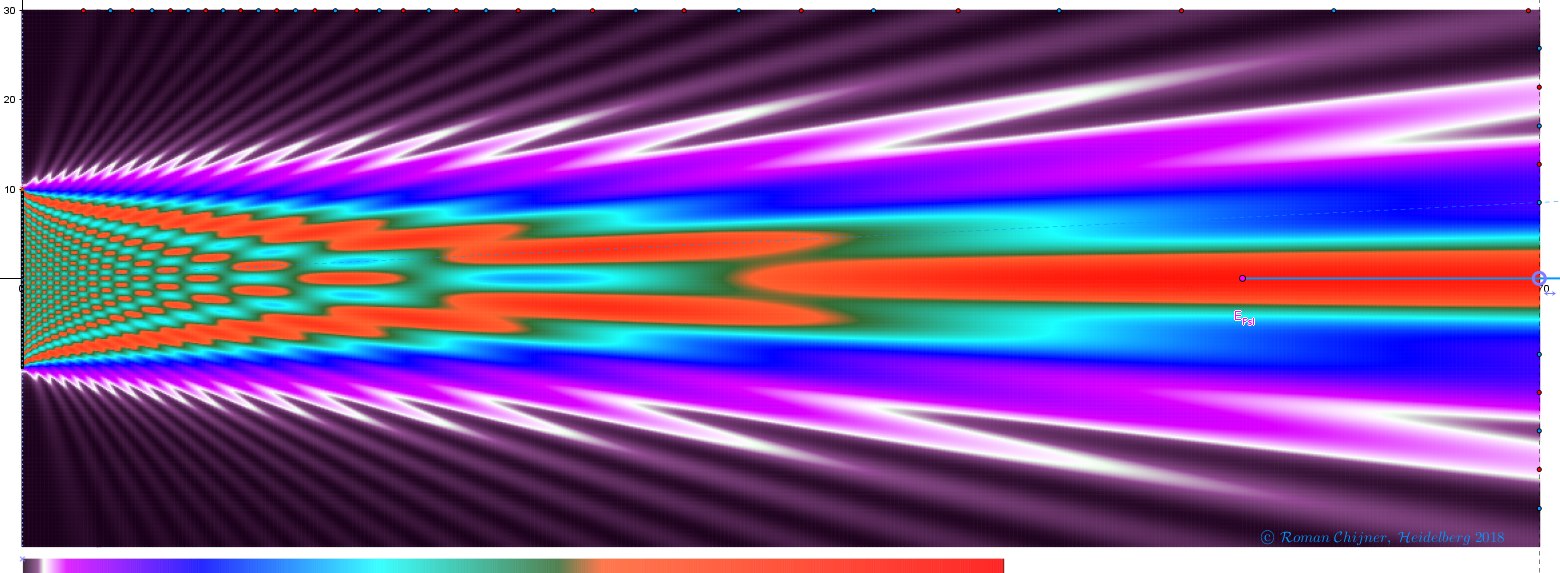
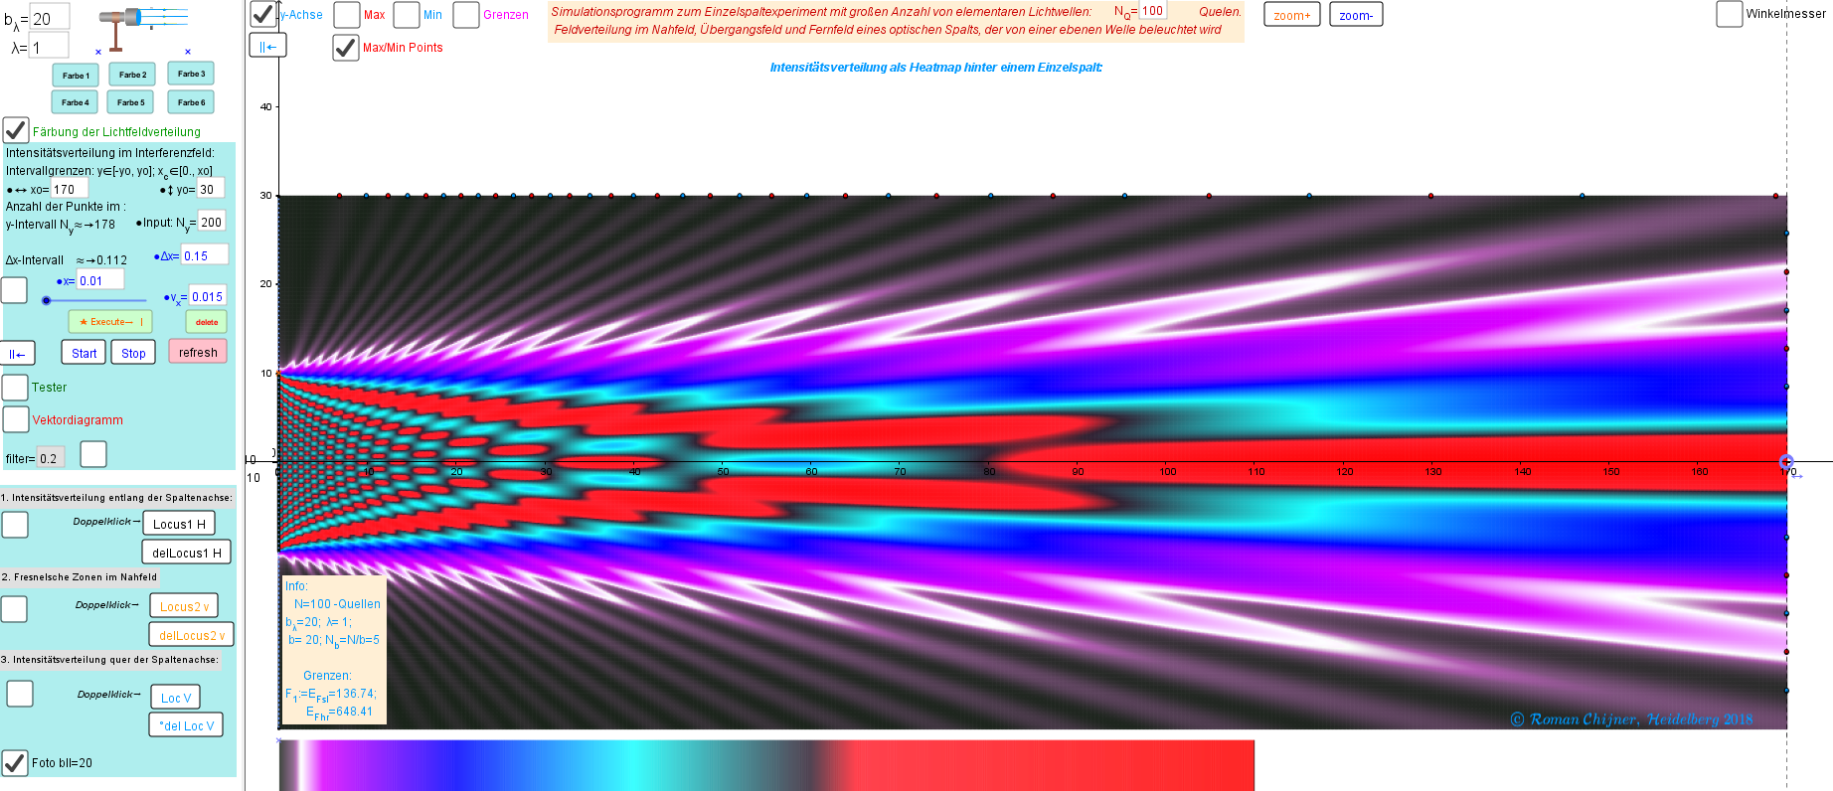
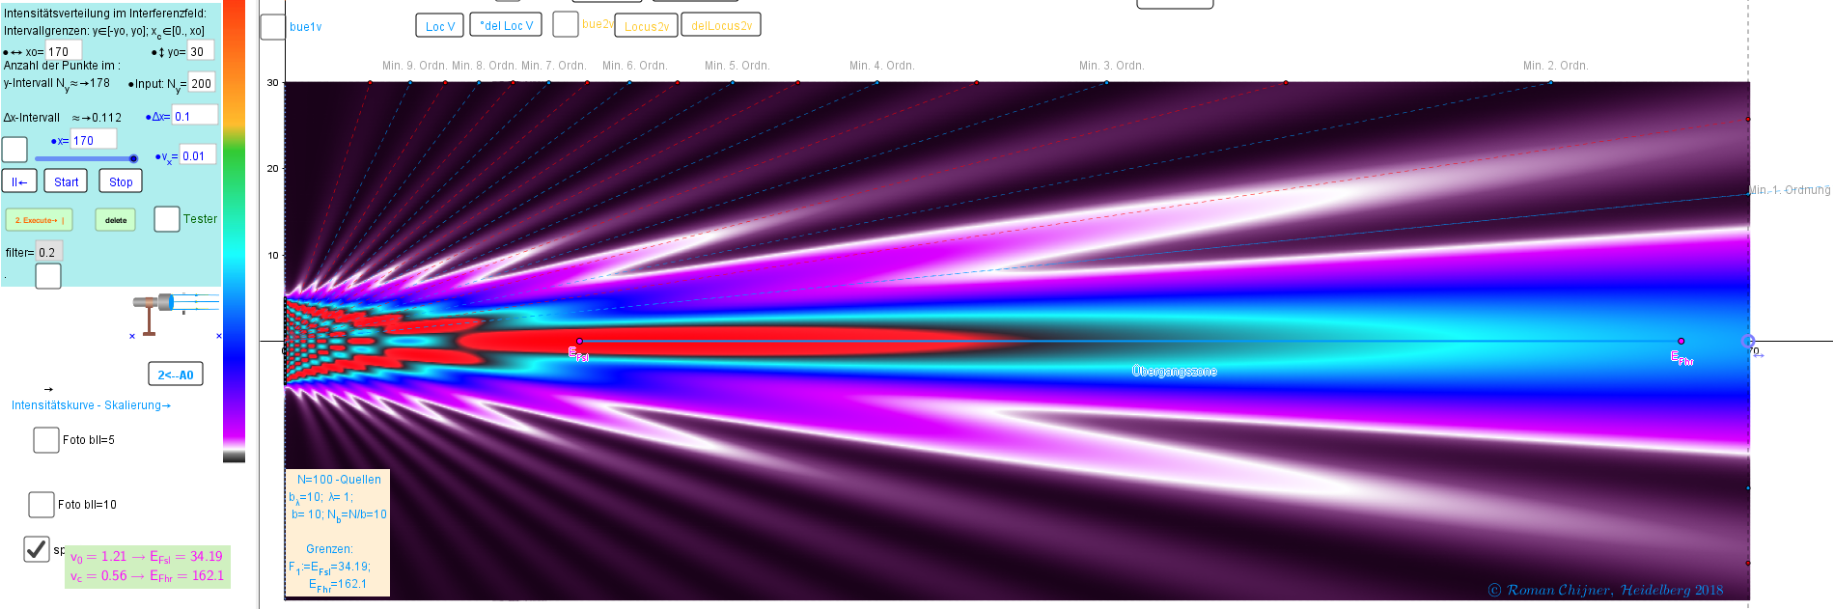
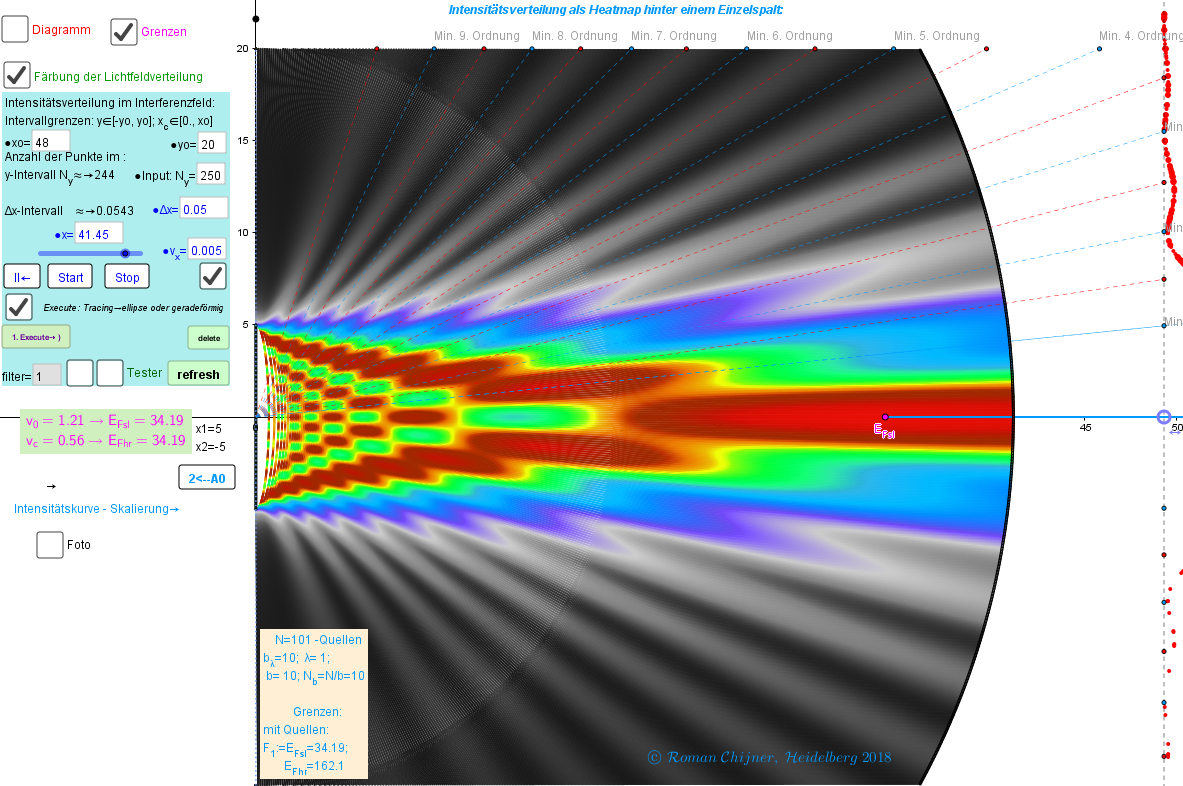
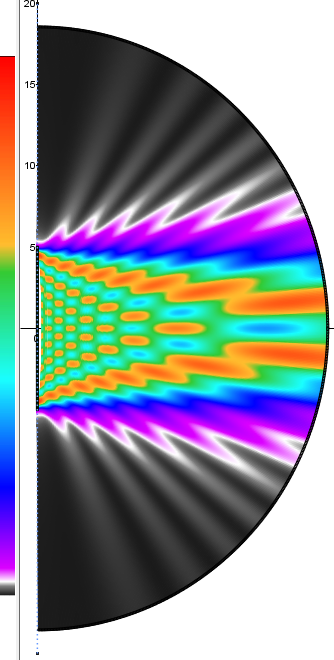
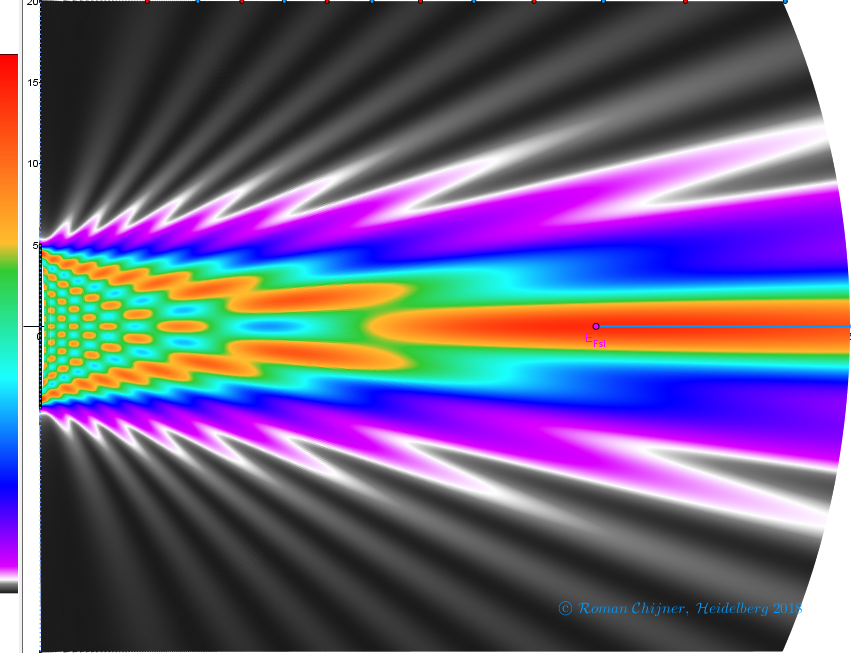
Bilder₂ zum Applet ●Heatmap hinter einem Einzelspalt, die als System von Punktquellen gedämpfter Wellen dargestellt wird.
Autor:
Roman Chijner
Applet:
https://www.geogebra.org/m/dqyhaarg
b_λ=20, Farbe 6, N_Q=200
b_λ=20, Farbe 3, N_Q=200
b_λ=20, Farbe 2, N_Q=200
b_λ=10, Farbe 3, N_Q=200
b_λ=10, Farbe 1, N_Q=100
Novos Materiais
Angle Addition: Warm Up Exercises
Hyperbolic Paraboloid
Untitled
Cartesian vs Polar
רישום חופשי
Descobrir recursos
Equidistance
Unit 9 Sketch
Test Interactive Worksheet
incenter
Calculating Distance formula Coordinate geometry
Explorar Tópicos
Integral Indefinida
Paralelepípedo
Integral Definida
Matemática
Ângulos