Practice Problems
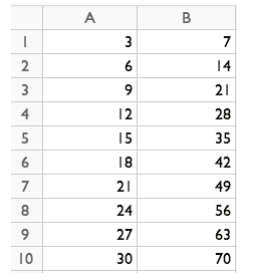
1. Fill Down
2. The data represent the average customer ratings for several items sold online.
a. Use the spreadsheet below to create a histogram for the data. Change the width of the bars in the histogram using the slider to create intervals with a width of 1, such as 0–1, 1–2, and so on.
b. Which interval has the highest frequency?
c. Describe the shape of the distribution.
3. The data represent the amount of corn, in bushels per acre, harvested from different locations.
a. Use the spreadsheet to create a dot plot.
Bushels of Corn Per Acre Dot Plot
b. Use the spreadsheet to create a box plot.
Bushels of Corn Per Acre Box Plot
c. What is the shape of the distribution?
4. A list of numbers is made with the pattern: Start with 11, and subtract 4 to find the
next number.
Here is the beginning of the list: 11, 7, 3, . . .
Use "fill down" in a spreadsheet to find the tenth number in this list.
What is the tenth number?