


Table to Scatter Plot

Skill:
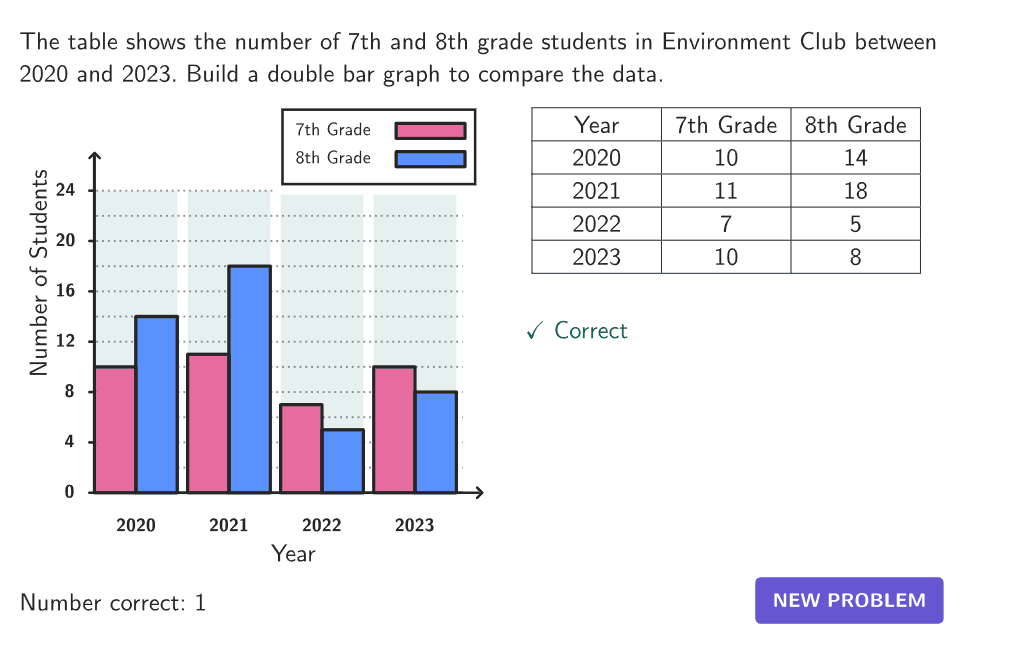
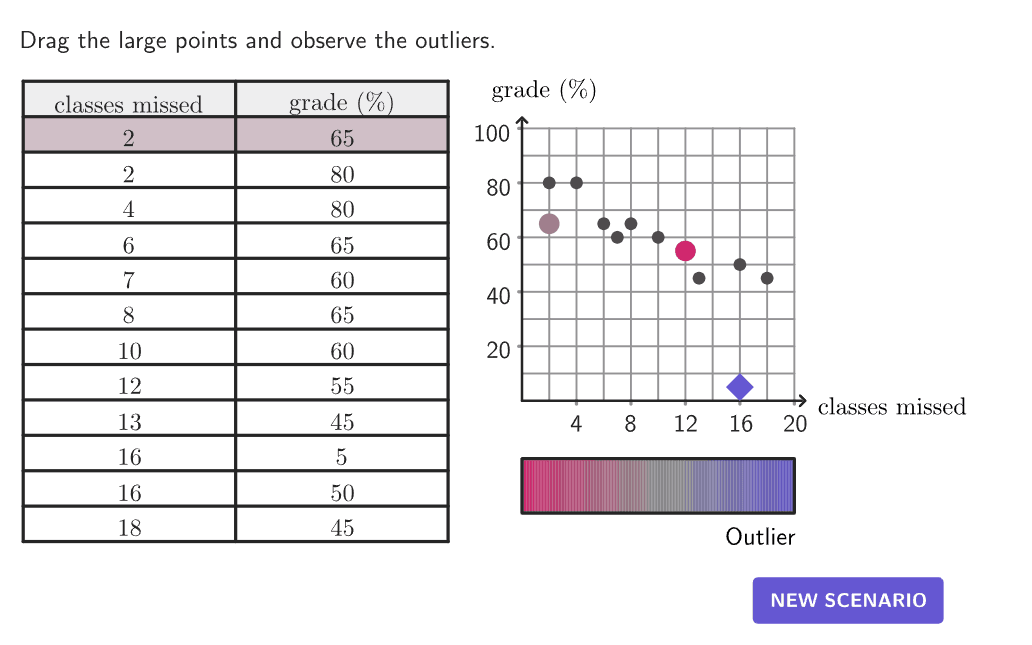
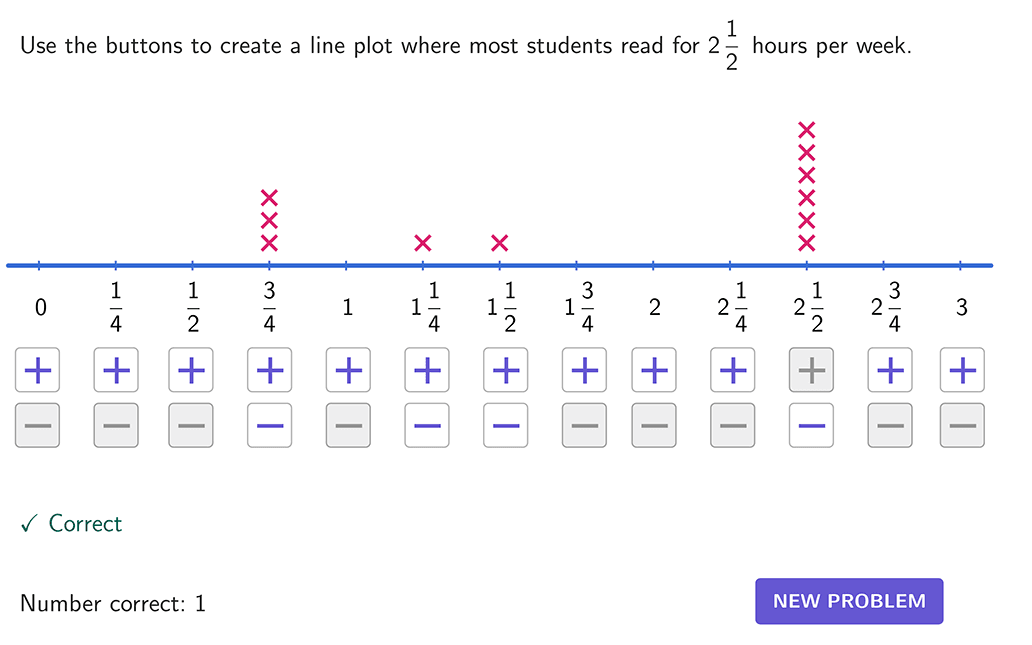
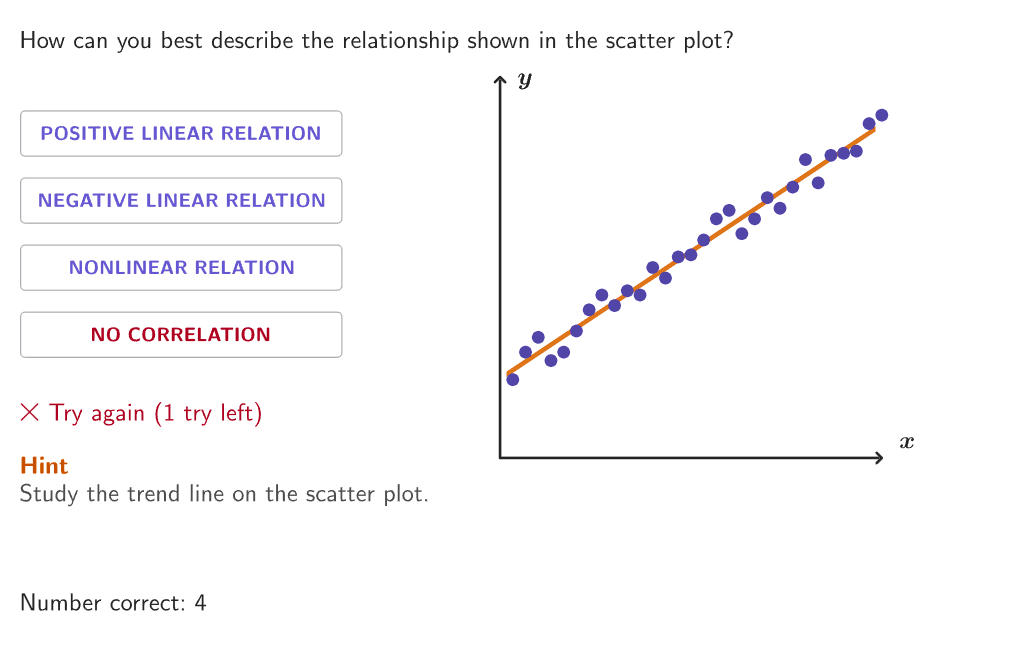
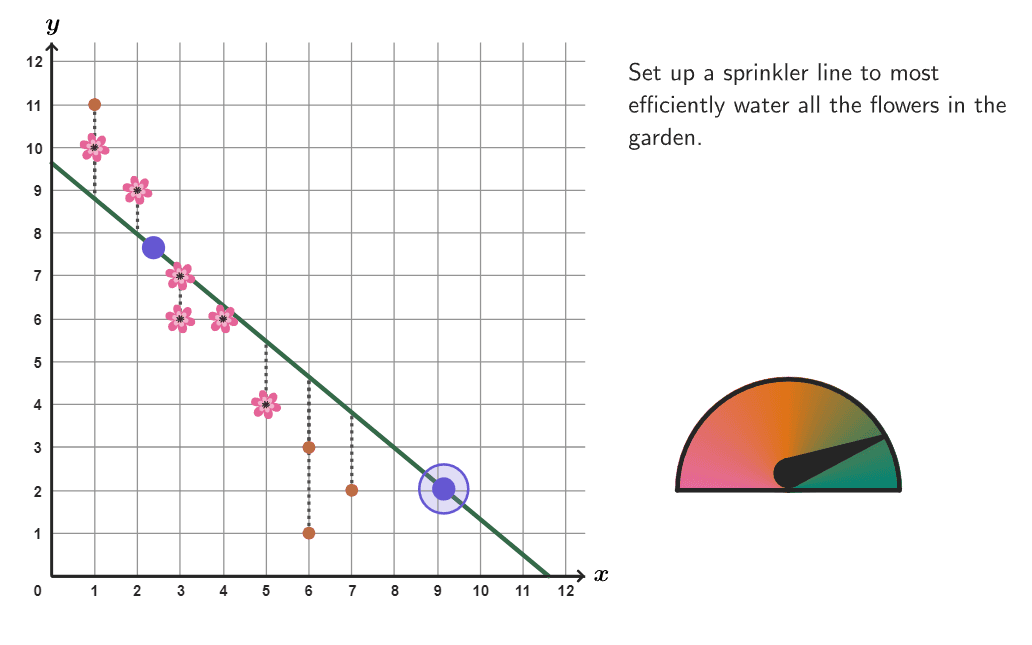
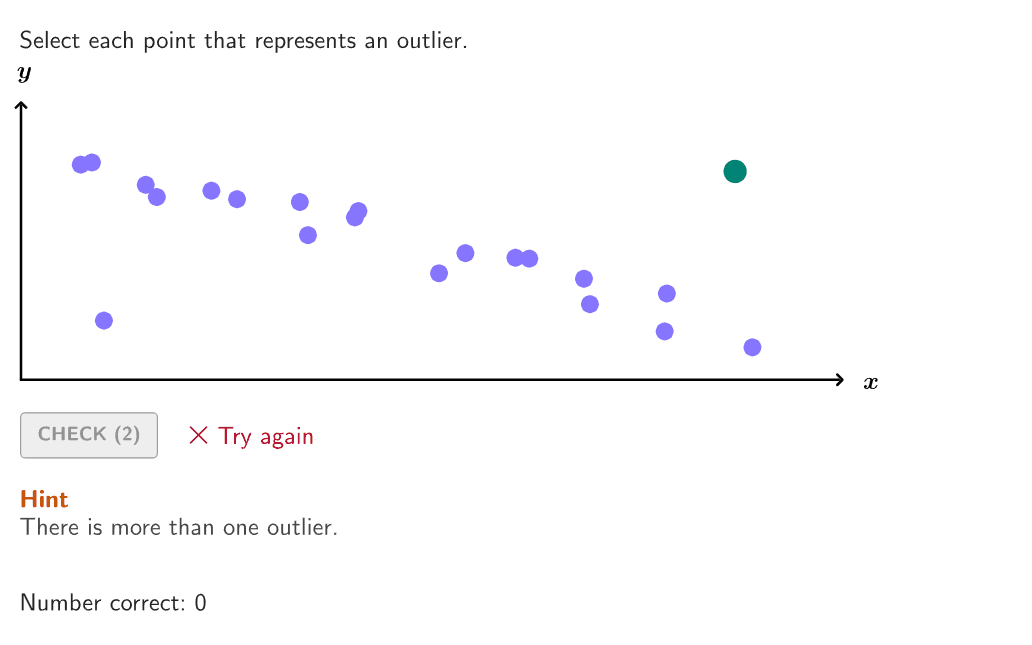
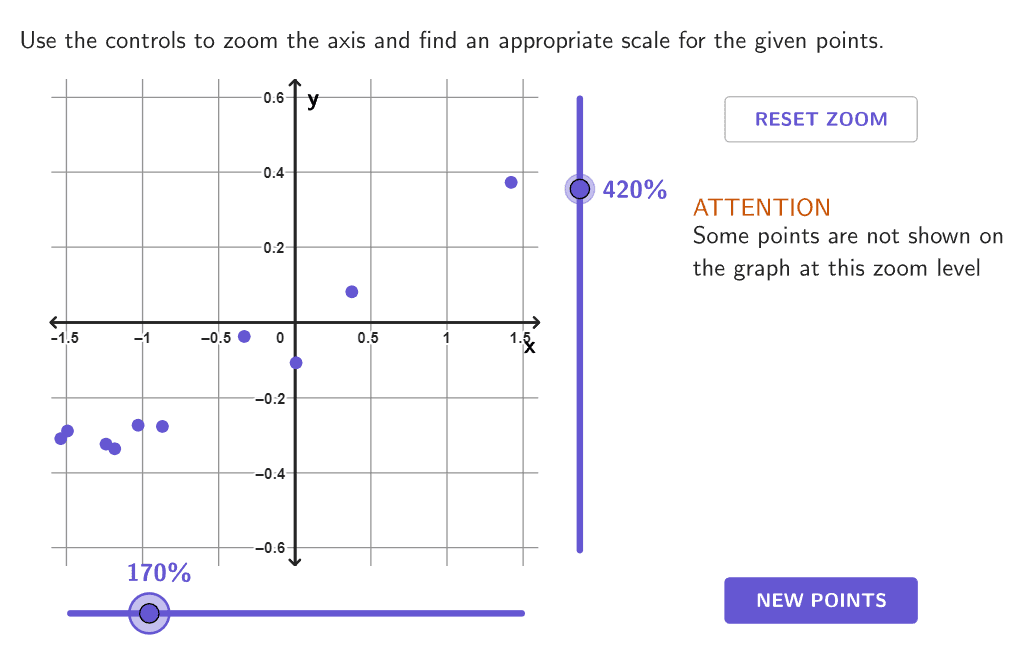
Organize, display, and interpret information in scatter plots. Approximate a trend line and identify the relationship as positive, negative, or no correlation.
Table to Scatter Plot
Reveal how to create a scatter plot by identifying dependent and independent variables, and then plotting data points from a table.
Putting It All Together
Answer these open ended questions on your own or with others to form deeper math connections.
Open-ended question 1
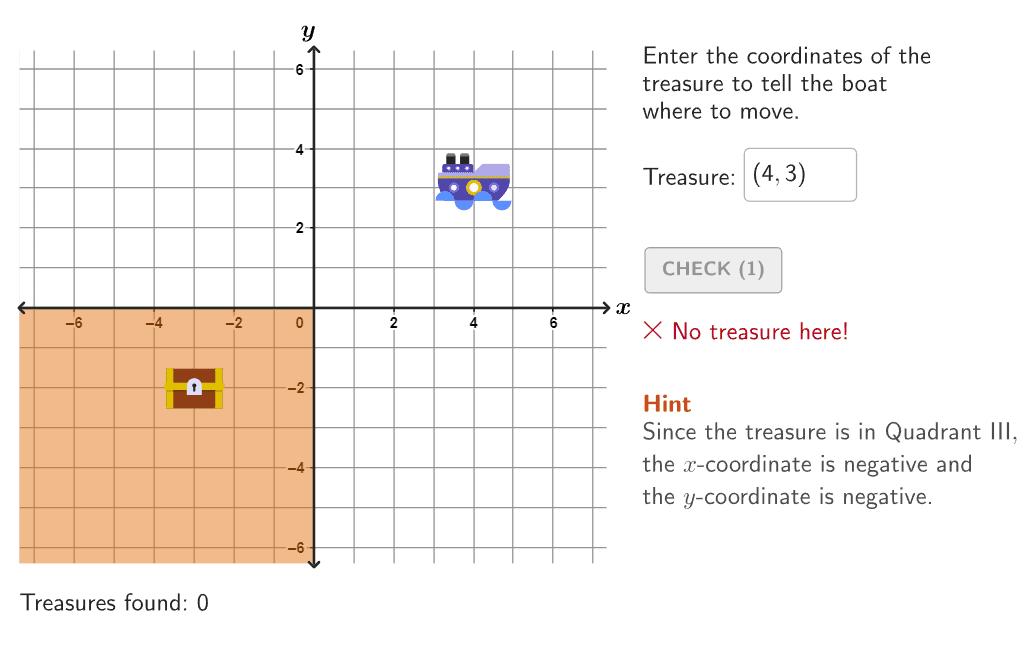
How did you figure out how the axes should be labelled?
Text and math input
Open-ended question 2
What trends do you notice in these graphs?
Text and math input
Explore more
Prerequisite Resources
More from Diagrams