Rate of Change from a Table
Rate of Change from a Table
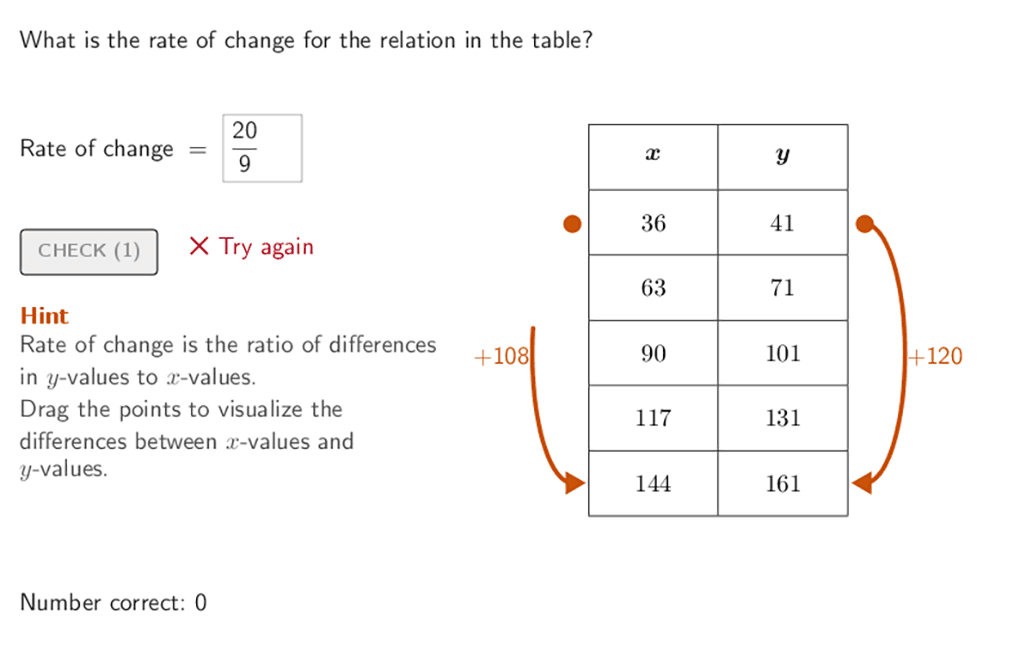
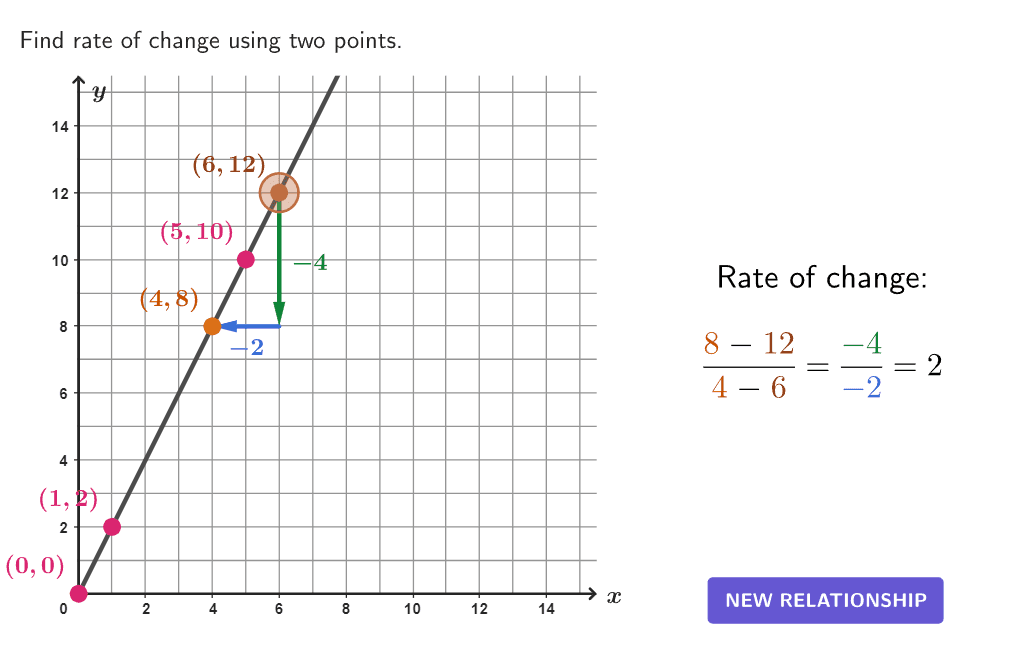
Explore relationships between rows of x and y values presented in a table.
Putting It All Together
Answer these open ended questions on your own or with others to form deeper math connections.
Open-ended question 1
When you selected different rows in the table, what did you notice about the rate of change?
Text and math input
Open-ended question 2
Describe how you can calculate the rate of change in a table of values.
Text and math input
Open-ended question 3
What happens to the rate of change when you change the order for selecting the first and second row of values?
Text and math input
Explore more
Prerequisite Resources
More from Ratio or Rate Given a Table or Graph
Next Resources


