


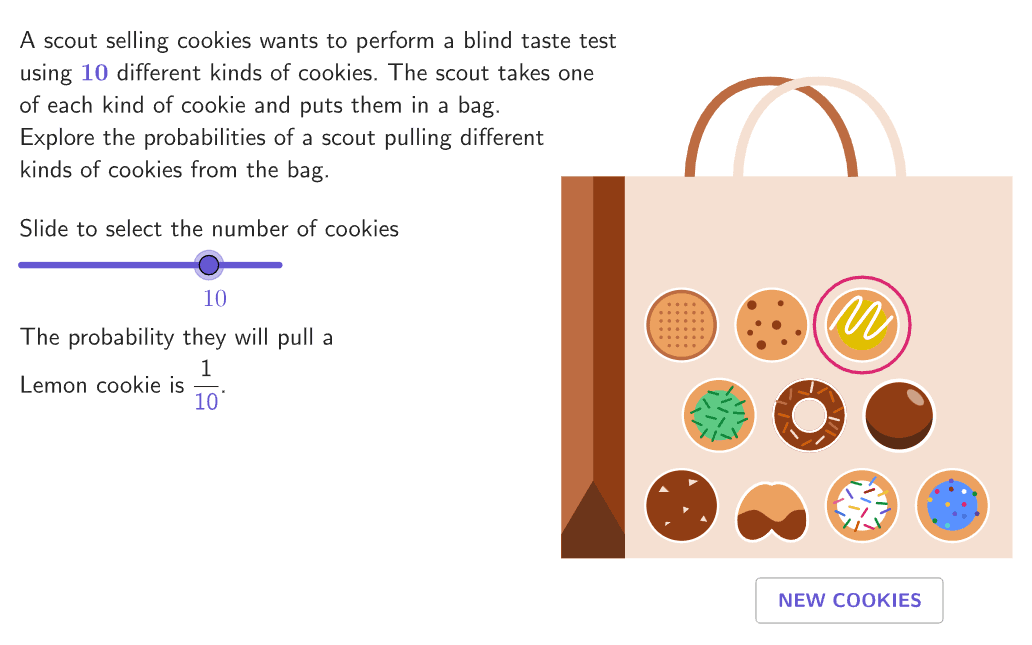
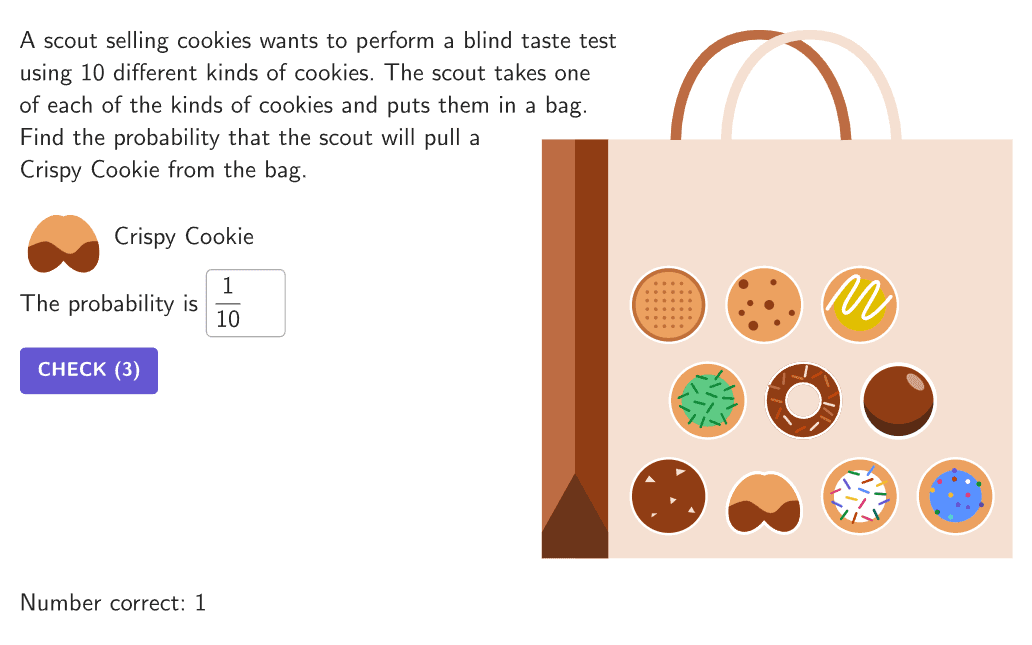
Frequency in Probability Models for Cookie Ingredients
Frequency in Probability Models for Cookie Ingredients
Draw conclusions about probability with bar graphs depicting data about cookie toppings.
Putting It All Together
Answer these open ended questions on your own or with others to form deeper math connections.
Open-ended question 1
As more cookies are pulled, what happens to the probabilities of a given ingredient?
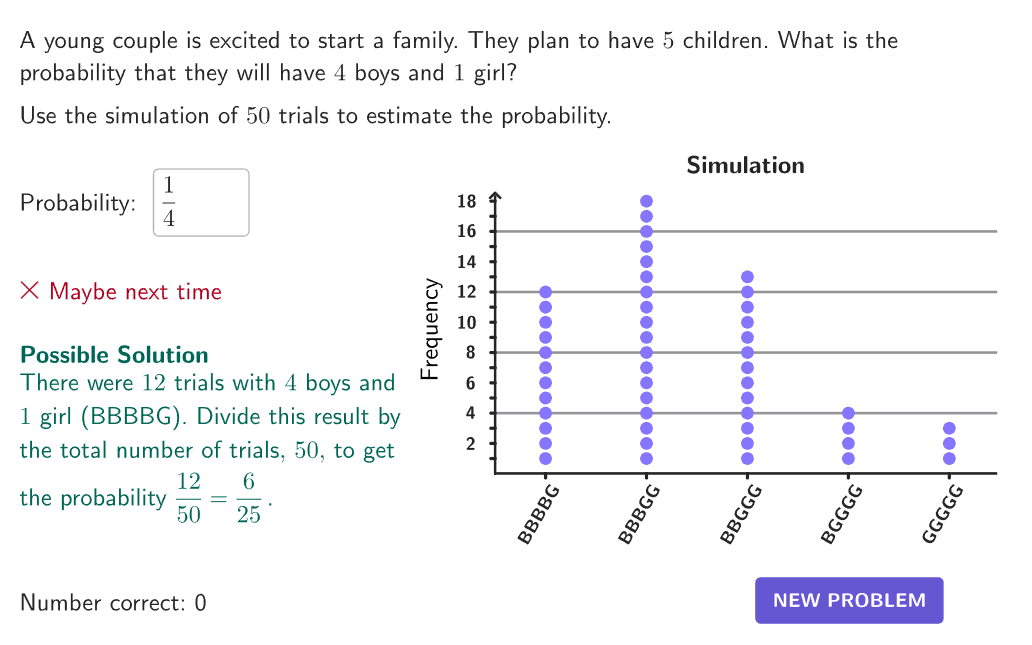
Text and maths input
Open-ended question 2
Compare the probability of each ingredient to its frequency. What do you observe?
Text and maths input
Explore more
Prerequisite Resources
More from Frequency Tables, Line Plots and Bar Graphs
Next Resources