Statistics
Learn and practice identifying statistical questions, measuring variability and making predictions from sample data with interactive resources from GeoGebra.
Middle School
GRADES 6-8
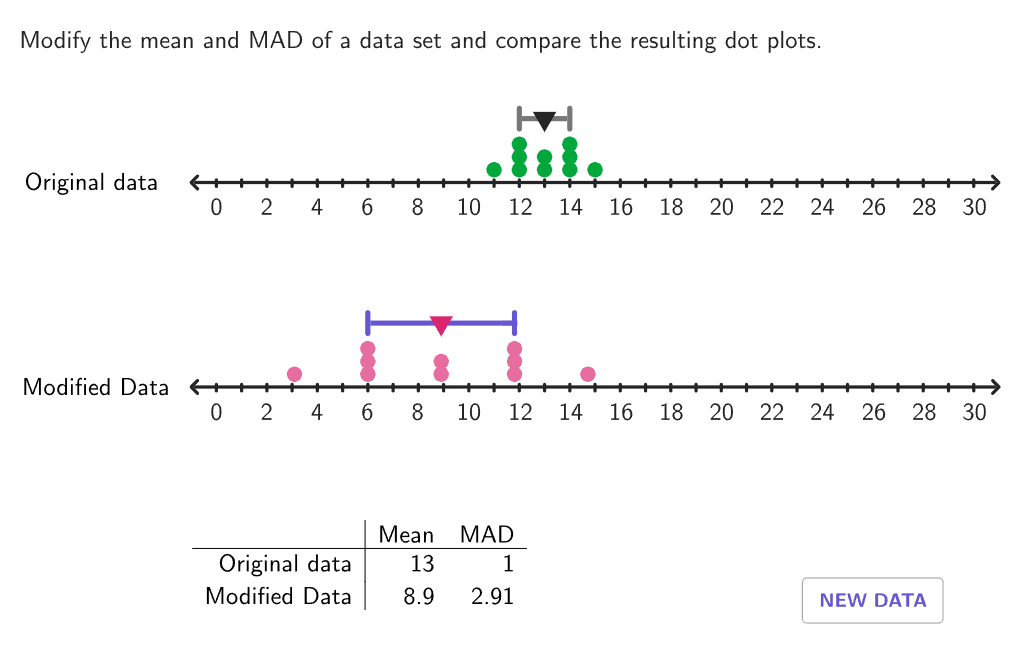
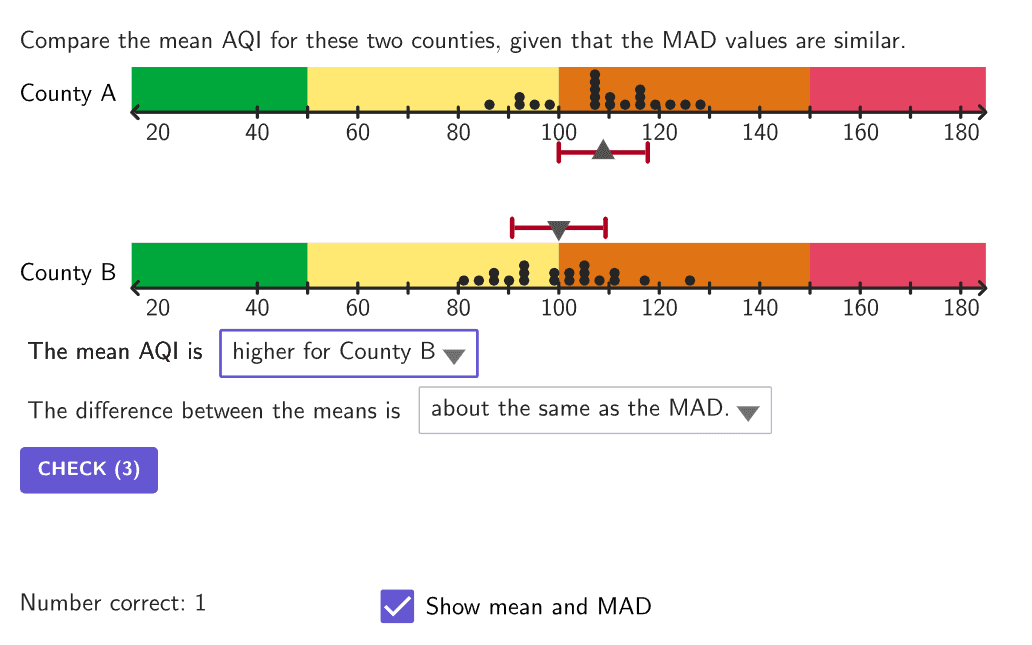
Comparing Data Distributions
Compare data and distributions of data, numerical and contextual, to draw conclusions, considering the measures of center and measures of variability.
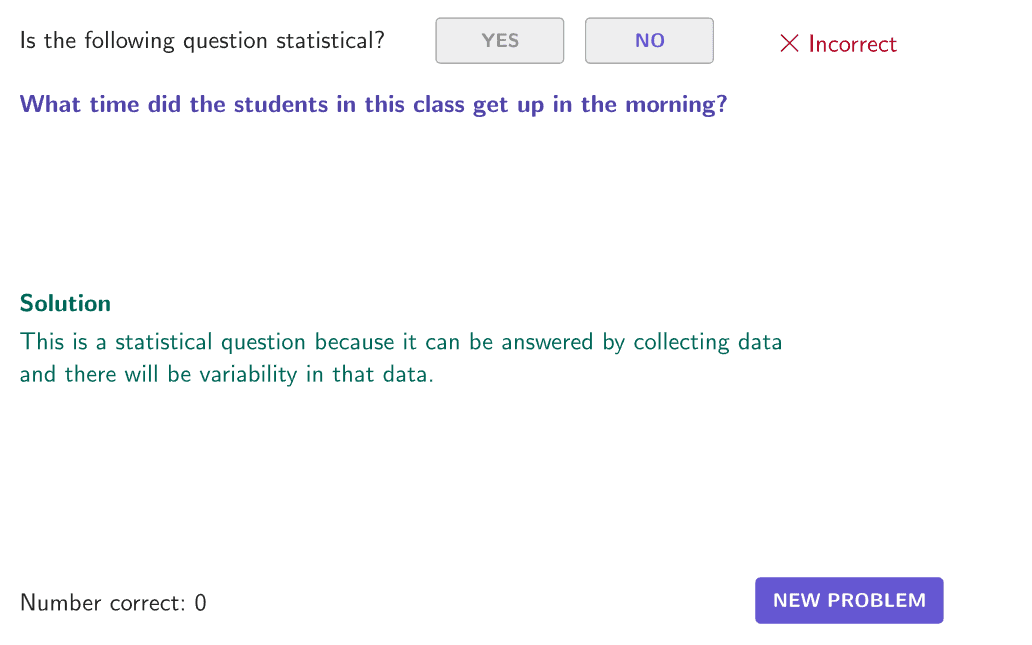
Identifying Statistical Questions
Recognize that a statistical question is one that will require gathering data that has variability.
Inferences From Samples
Make inferences about a population based on a sample and compare variation in multiple samples.
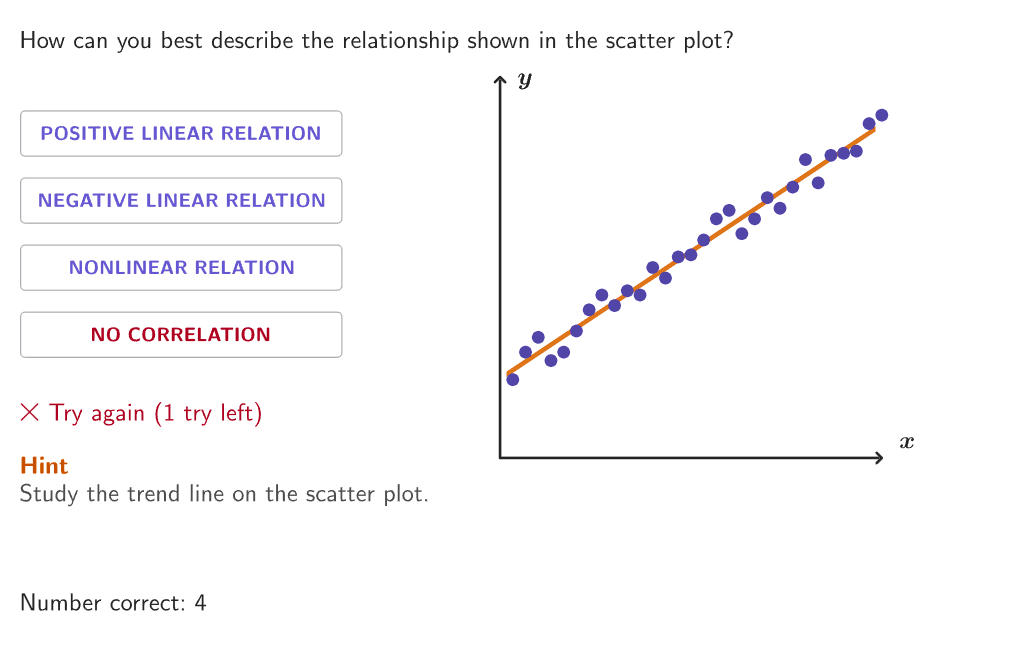
Linear and Nonlinear Relationships in Data Sets
Identify linear and nonlinear relationships in data sets.

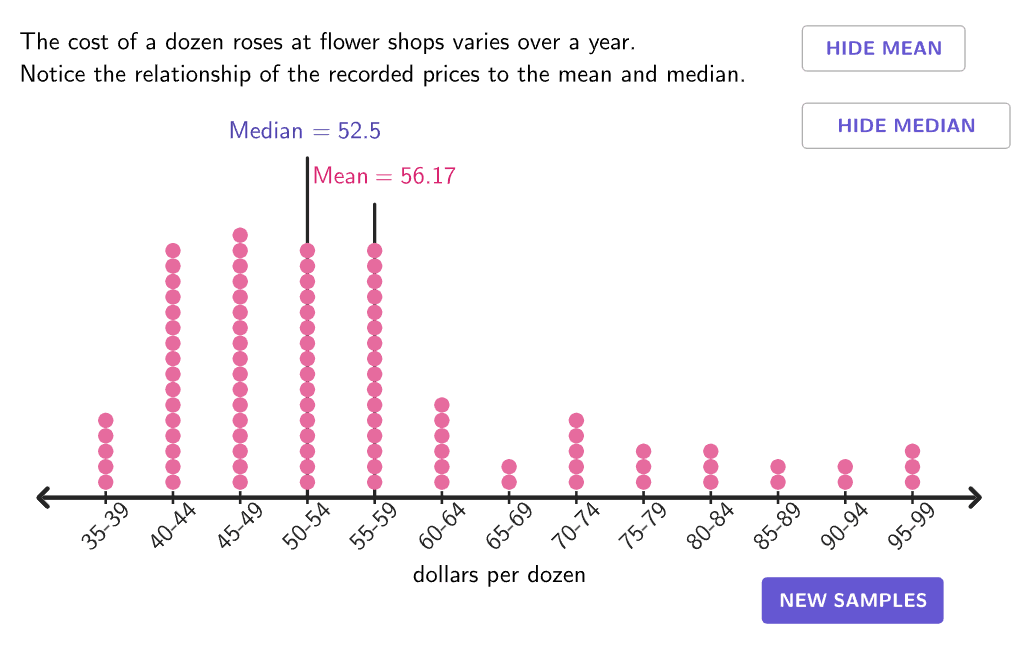
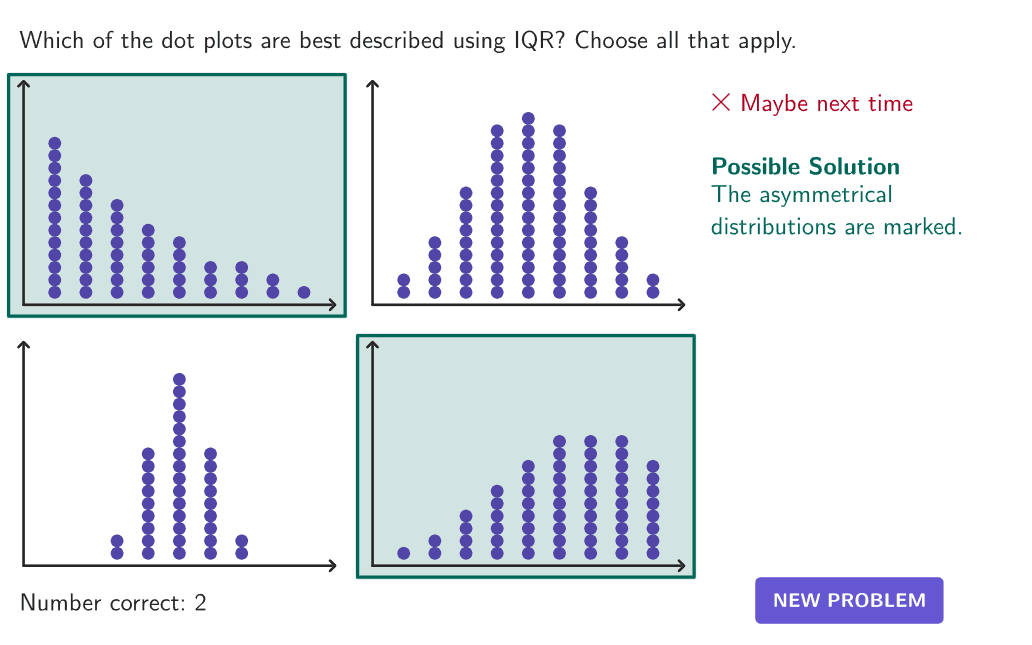
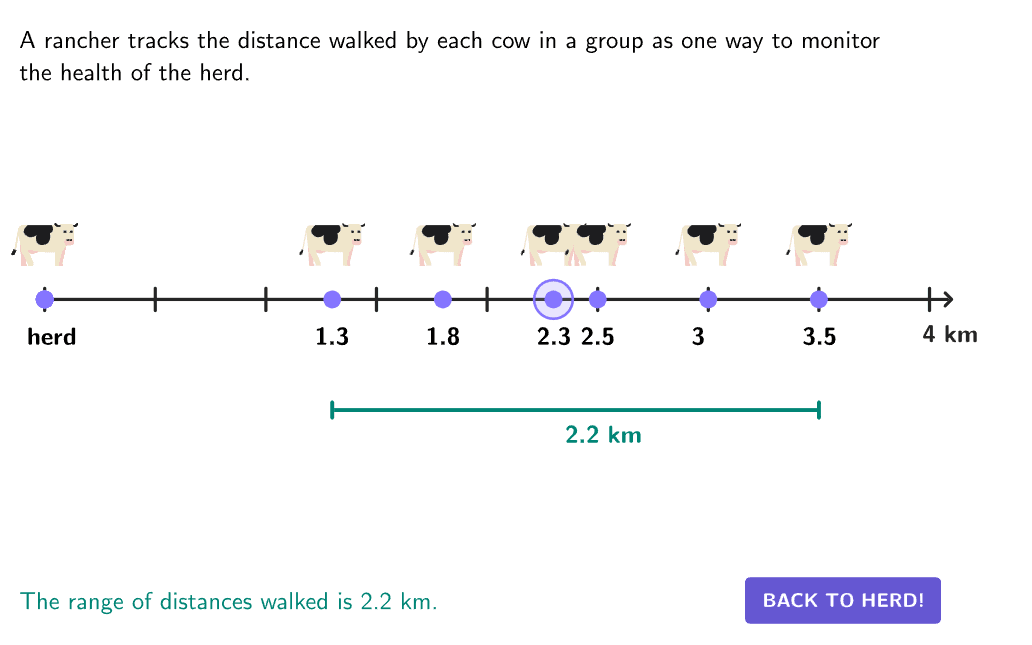
Measures of Variability
Select the appropriate measure of variability; choose a measure of variability based on the presence of outliers, clusters, and the shape of the data distribution.
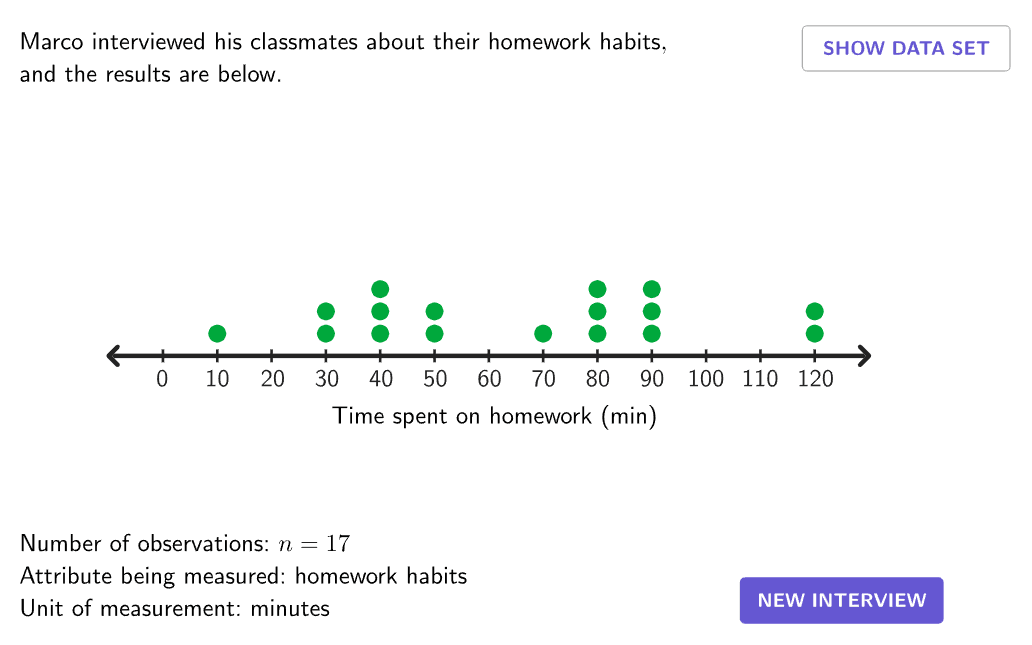
Observation, Measurement, and Sampling
Describe a data set by its number of observations, what is being measured, and the units of measurement.

Population vs. Sample
Distinguish between a population and a sample and draw conclusions about the sample (random or biased).
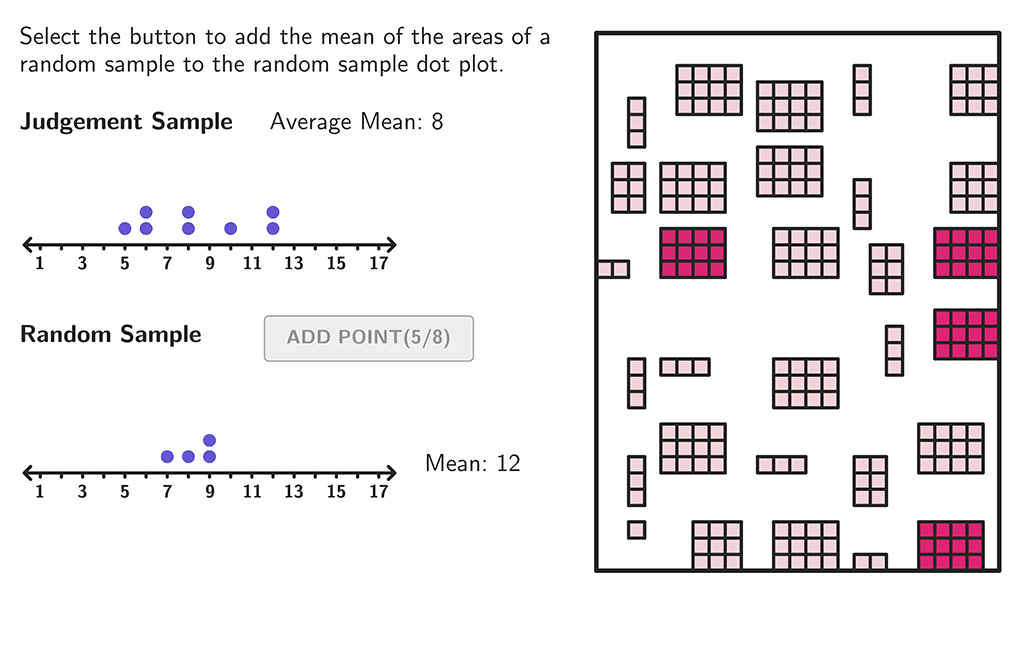
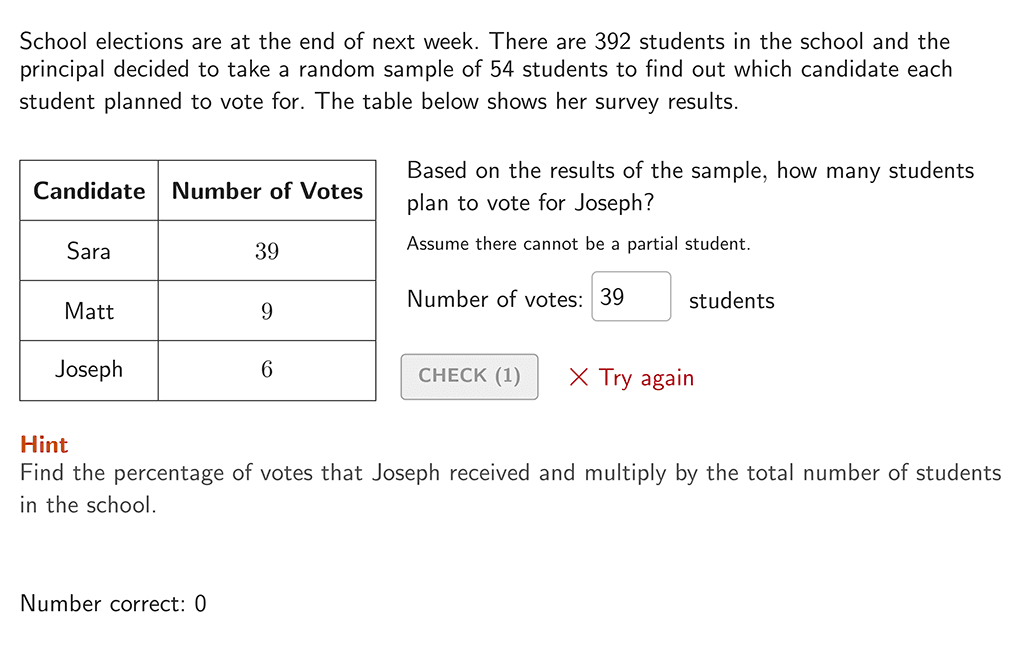
Predictions From Samples
Make predictions based on results from surveys and samples.
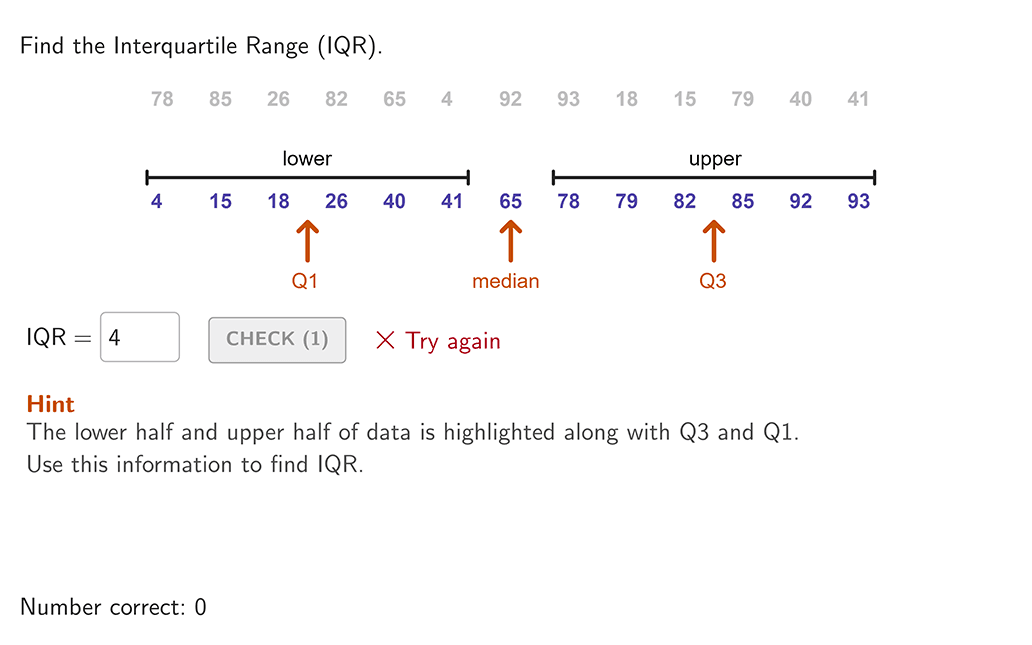
Quartiles and Interquartile Range of Data
Determine the quartiles or interquartile range for a set of data.
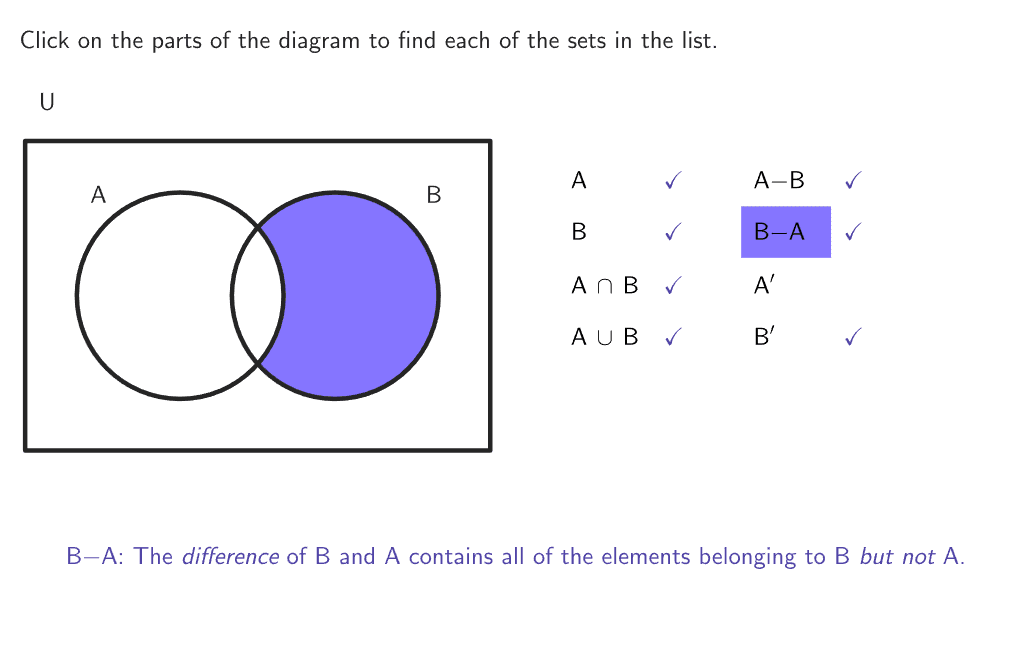
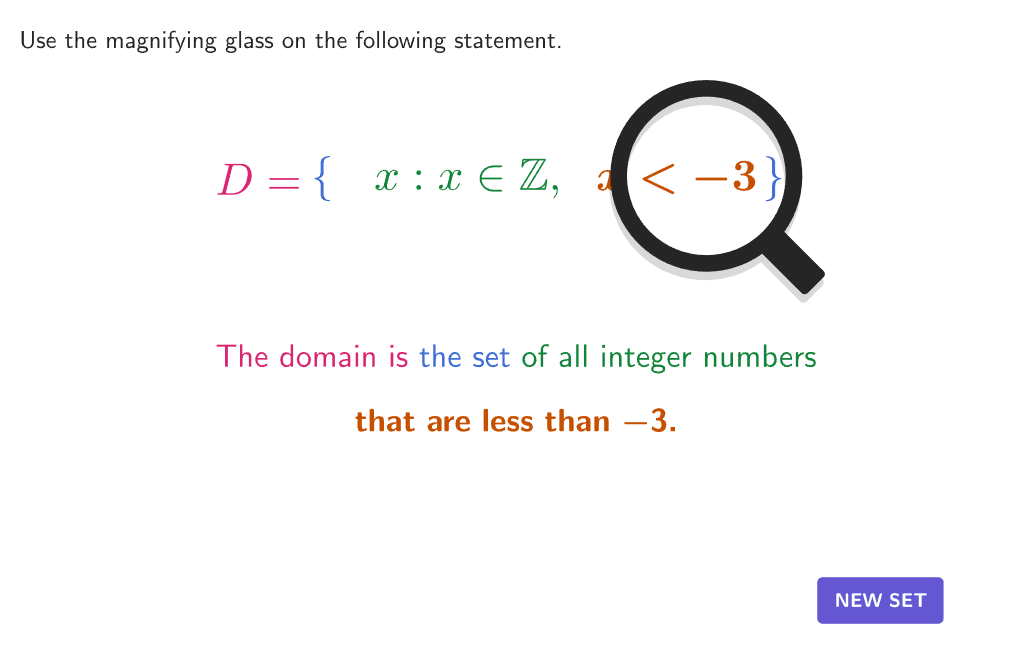
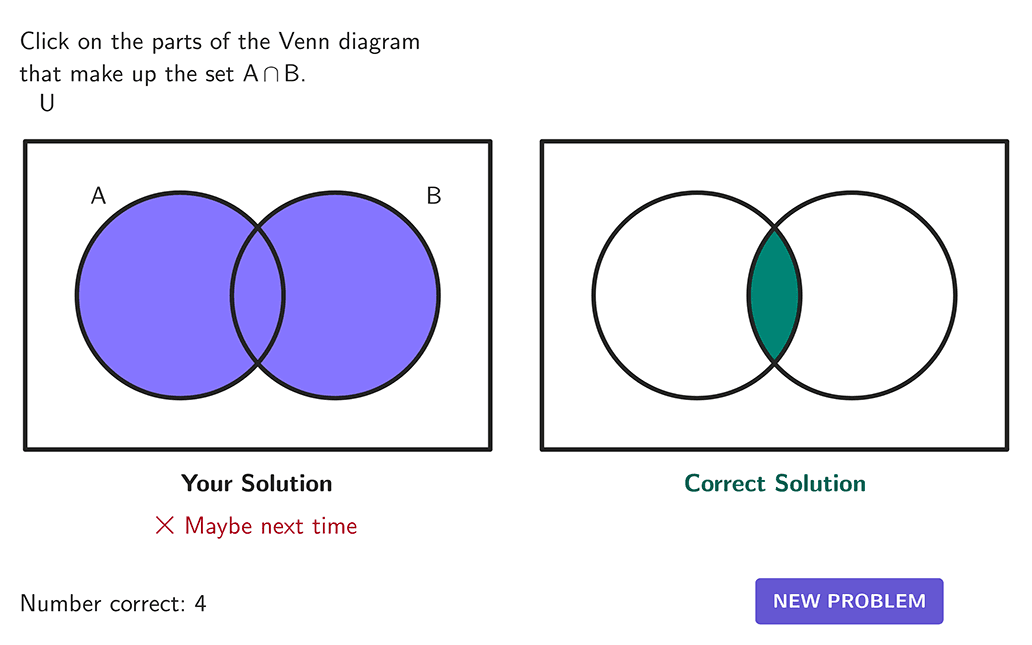
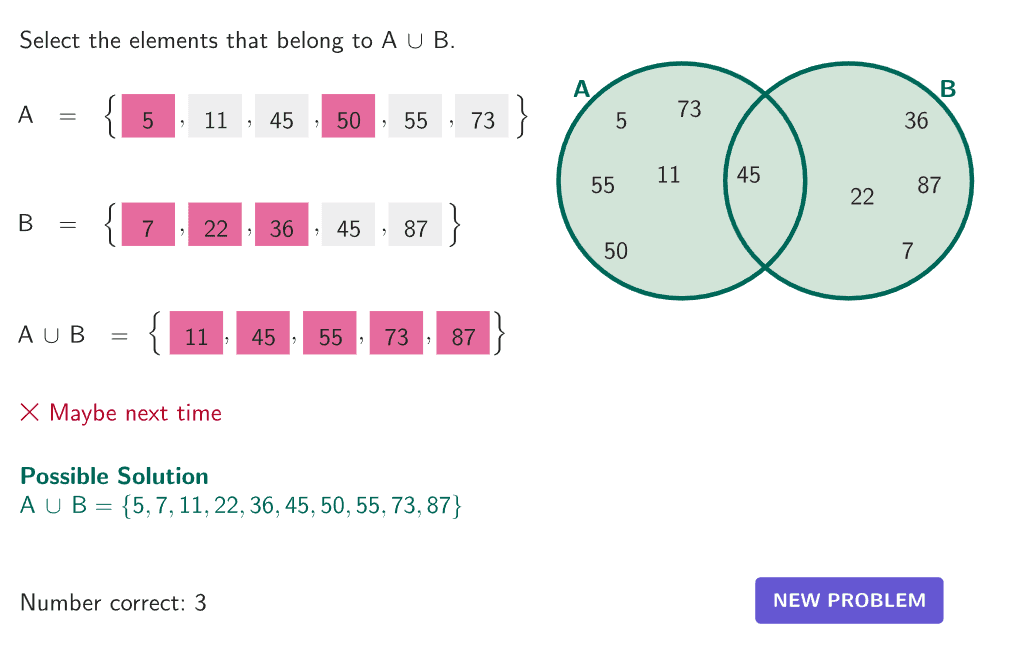
Set Theory
Use set notation to describe domains, ranges, intersection, and union of sets. Identify cardinality of sets, equivalent sets, disjoint sets, complement, or subsets.
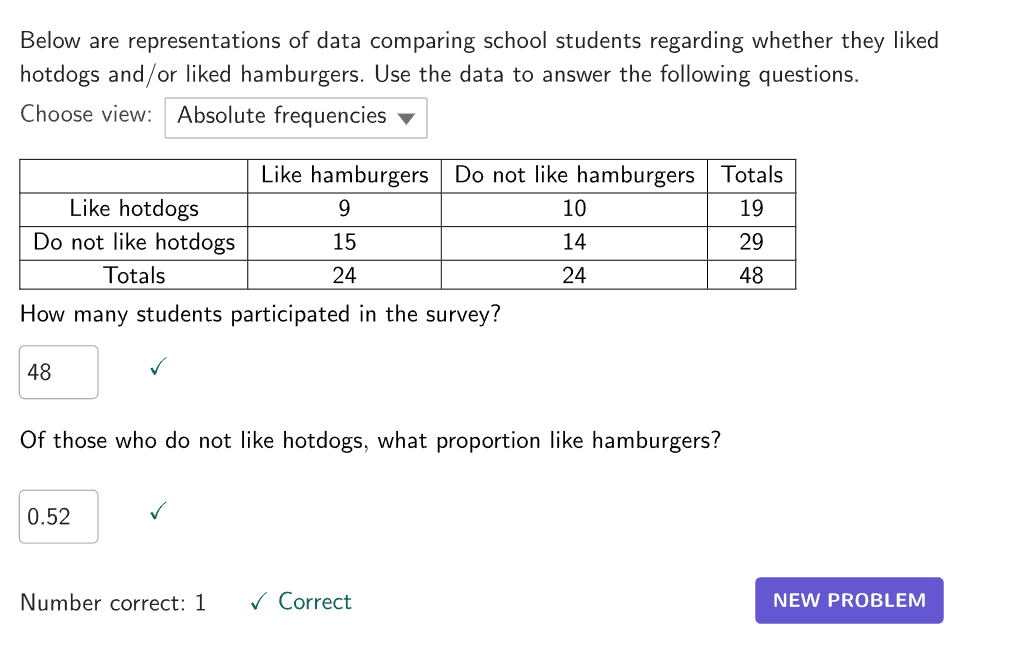
Two-way tables
Construct and interpret a two-way table to display two categories of data from the same source.
High School
GRADES 9-12
Correlation Coefficient, Correlation and Causation- Differences, Design and Examples
Use models to make predictions and interpret the correlation coefficient of the model; distinguish between correlation and causation.

Lines of Best Fit
Derive a linear equation that models a set of data (line of best fit) using calculators. Use the model to make predictions.

Verwante onderwerpen
Community materiaal
Verken een uitgebreide verzameling van meer dan een miljoen wiskunde- en natuurkunde bestanden, oefeningen en lessen, minutieus gecreëerd door onze wereldwijde GeoGebra community. Dompel jezelf onder in de grenzeloze mogelijkheden die op je wachten.

Start vandaag met GeoGebra
Creëer een gratis account waarmee je op elk moment je vorderingen kunt opslaan en duizenden bestanden kunt gebruiken, aanpassen en delen met anderen